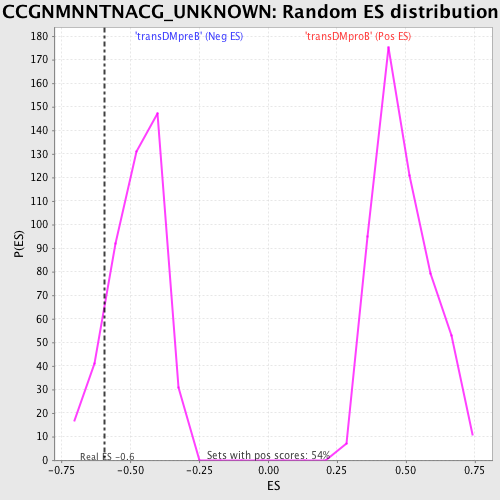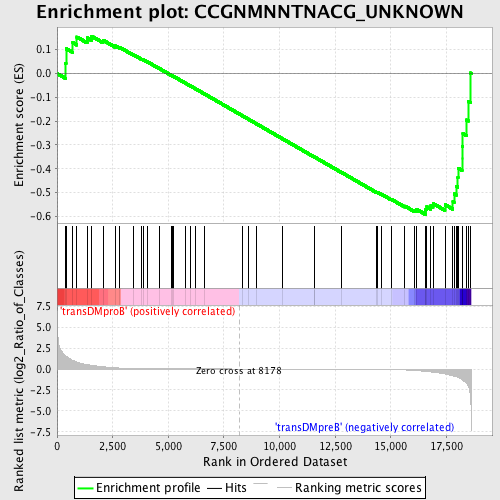
Profile of the Running ES Score & Positions of GeneSet Members on the Rank Ordered List
| Dataset | Set_04_transDMproB_versus_transDMpreB.phenotype_transDMproB_versus_transDMpreB.cls #transDMproB_versus_transDMpreB.phenotype_transDMproB_versus_transDMpreB.cls #transDMproB_versus_transDMpreB_repos |
| Phenotype | phenotype_transDMproB_versus_transDMpreB.cls#transDMproB_versus_transDMpreB_repos |
| Upregulated in class | transDMpreB |
| GeneSet | CCGNMNNTNACG_UNKNOWN |
| Enrichment Score (ES) | -0.59213674 |
| Normalized Enrichment Score (NES) | -1.2392207 |
| Nominal p-value | 0.12418301 |
| FDR q-value | 0.6697294 |
| FWER p-Value | 1.0 |
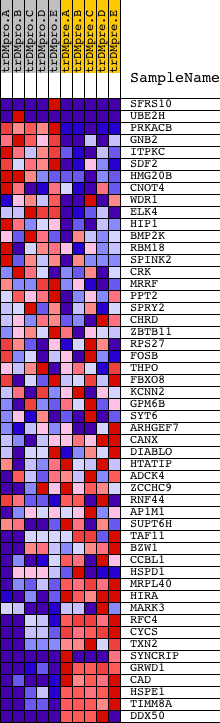
| PROBE | DESCRIPTION (from dataset) | GENE SYMBOL | GENE_TITLE | RANK IN GENE LIST | RANK METRIC SCORE | RUNNING ES | CORE ENRICHMENT | |
|---|---|---|---|---|---|---|---|---|
| 1 | SFRS10 | 9818 1722 5441 | 368 | 1.583 | 0.0442 | No | ||
| 2 | UBE2H | 5823 5822 | 402 | 1.542 | 0.1047 | No | ||
| 3 | PRKACB | 15140 | 705 | 1.014 | 0.1294 | No | ||
| 4 | GNB2 | 9026 | 889 | 0.838 | 0.1534 | No | ||
| 5 | ITPKC | 17919 | 1351 | 0.523 | 0.1497 | No | ||
| 6 | SDF2 | 20762 | 1546 | 0.441 | 0.1571 | No | ||
| 7 | HMG20B | 19676 | 2064 | 0.266 | 0.1400 | No | ||
| 8 | CNOT4 | 7010 1022 | 2618 | 0.142 | 0.1160 | No | ||
| 9 | WDR1 | 16544 3592 | 2799 | 0.113 | 0.1108 | No | ||
| 10 | ELK4 | 8895 4664 3937 | 3449 | 0.053 | 0.0780 | No | ||
| 11 | HIP1 | 5676 | 3797 | 0.036 | 0.0608 | No | ||
| 12 | BMP2K | 3657 16786 | 3876 | 0.033 | 0.0579 | No | ||
| 13 | RBM18 | 2789 14604 | 4075 | 0.027 | 0.0483 | No | ||
| 14 | SPINK2 | 16502 | 4592 | 0.016 | 0.0212 | No | ||
| 15 | CRK | 4559 1249 | 5134 | 0.011 | -0.0075 | No | ||
| 16 | MRRF | 12594 2837 | 5182 | 0.011 | -0.0097 | No | ||
| 17 | PPT2 | 1617 12034 | 5226 | 0.010 | -0.0116 | No | ||
| 18 | SPRY2 | 21725 | 5759 | 0.007 | -0.0399 | No | ||
| 19 | CHRD | 22817 | 5992 | 0.006 | -0.0522 | No | ||
| 20 | ZBTB11 | 11309 | 6198 | 0.006 | -0.0630 | No | ||
| 21 | RPS27 | 12183 | 6613 | 0.004 | -0.0851 | No | ||
| 22 | FOSB | 17945 | 8326 | -0.000 | -0.1773 | No | ||
| 23 | THPO | 22636 | 8587 | -0.001 | -0.1913 | No | ||
| 24 | FBXO8 | 18616 3896 | 8953 | -0.002 | -0.2109 | No | ||
| 25 | KCNN2 | 8933 1949 | 10148 | -0.005 | -0.2750 | No | ||
| 26 | GPM6B | 9034 | 11580 | -0.009 | -0.3517 | No | ||
| 27 | SYT6 | 13437 7042 12040 | 11583 | -0.009 | -0.3514 | No | ||
| 28 | ARHGEF7 | 3823 | 12777 | -0.016 | -0.4151 | No | ||
| 29 | CANX | 4474 | 14375 | -0.039 | -0.4995 | No | ||
| 30 | DIABLO | 16375 | 14401 | -0.039 | -0.4993 | No | ||
| 31 | HTATIP | 3690 | 14563 | -0.044 | -0.5062 | No | ||
| 32 | ADCK4 | 13364 | 15007 | -0.061 | -0.5276 | No | ||
| 33 | ZCCHC9 | 21398 | 15625 | -0.107 | -0.5564 | No | ||
| 34 | RNF44 | 8364 | 16072 | -0.170 | -0.5736 | No | ||
| 35 | AP1M1 | 18571 | 16161 | -0.188 | -0.5708 | No | ||
| 36 | SUPT6H | 9940 | 16559 | -0.283 | -0.5807 | Yes | ||
| 37 | TAF11 | 12733 | 16567 | -0.286 | -0.5695 | Yes | ||
| 38 | BZW1 | 7356 | 16621 | -0.299 | -0.5603 | Yes | ||
| 39 | CCBL1 | 14630 | 16801 | -0.346 | -0.5559 | Yes | ||
| 40 | HSPD1 | 4078 9129 | 16896 | -0.375 | -0.5458 | Yes | ||
| 41 | MRPL40 | 22641 | 17436 | -0.591 | -0.5510 | Yes | ||
| 42 | HIRA | 4852 9090 | 17792 | -0.810 | -0.5374 | Yes | ||
| 43 | MARK3 | 9369 | 17845 | -0.854 | -0.5056 | Yes | ||
| 44 | RFC4 | 1735 22627 | 17938 | -0.919 | -0.4734 | Yes | ||
| 45 | CYCS | 8821 | 18014 | -0.996 | -0.4372 | Yes | ||
| 46 | TXN2 | 22227 | 18024 | -1.004 | -0.3971 | Yes | ||
| 47 | SYNCRIP | 3078 3035 3107 | 18203 | -1.259 | -0.3558 | Yes | ||
| 48 | GRWD1 | 8317 | 18204 | -1.261 | -0.3048 | Yes | ||
| 49 | CAD | 16886 | 18241 | -1.324 | -0.2532 | Yes | ||
| 50 | HSPE1 | 9133 | 18393 | -1.639 | -0.1951 | Yes | ||
| 51 | TIMM8A | 24062 | 18478 | -2.024 | -0.1178 | Yes | ||
| 52 | DDX50 | 3324 19749 | 18572 | -3.098 | 0.0024 | Yes |