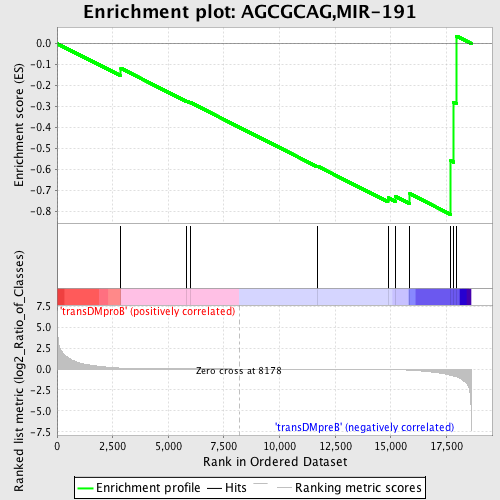
Profile of the Running ES Score & Positions of GeneSet Members on the Rank Ordered List
| Dataset | Set_04_transDMproB_versus_transDMpreB.phenotype_transDMproB_versus_transDMpreB.cls #transDMproB_versus_transDMpreB.phenotype_transDMproB_versus_transDMpreB.cls #transDMproB_versus_transDMpreB_repos |
| Phenotype | phenotype_transDMproB_versus_transDMpreB.cls#transDMproB_versus_transDMpreB_repos |
| Upregulated in class | transDMpreB |
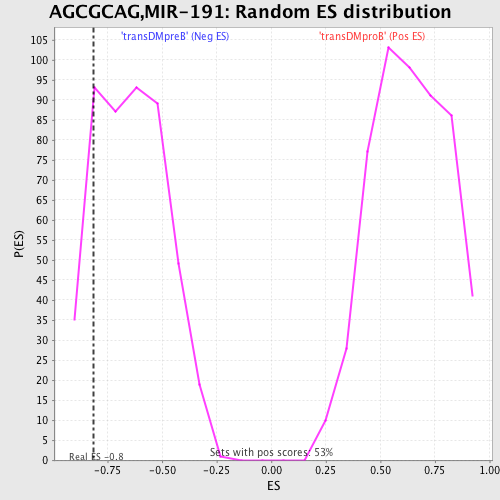
| GeneSet | AGCGCAG,MIR-191 |
| Enrichment Score (ES) | -0.8152143 |
| Normalized Enrichment Score (NES) | -1.2693008 |
| Nominal p-value | 0.15665236 |
| FDR q-value | 0.7314034 |
| FWER p-Value | 1.0 |
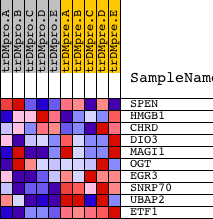
| PROBE | DESCRIPTION (from dataset) | GENE SYMBOL | GENE_TITLE | RANK IN GENE LIST | RANK METRIC SCORE | RUNNING ES | CORE ENRICHMENT | |
|---|---|---|---|---|---|---|---|---|
| 1 | SPEN | 12112 | 2866 | 0.104 | -0.1179 | No | ||
| 2 | HMGB1 | 9094 4855 | 5826 | 0.007 | -0.2745 | No | ||
| 3 | CHRD | 22817 | 5992 | 0.006 | -0.2811 | No | ||
| 4 | DIO3 | 19359 | 11695 | -0.010 | -0.5842 | No | ||
| 5 | MAGI1 | 19828 4816 1179 | 14874 | -0.055 | -0.7360 | Yes | ||
| 6 | OGT | 4241 24274 | 15198 | -0.073 | -0.7283 | Yes | ||
| 7 | EGR3 | 4656 | 15854 | -0.136 | -0.7163 | Yes | ||
| 8 | SNRP70 | 1186 | 17695 | -0.739 | -0.5592 | Yes | ||
| 9 | UBAP2 | 15912 | 17817 | -0.826 | -0.2793 | Yes | ||
| 10 | ETF1 | 23467 | 17951 | -0.929 | 0.0357 | Yes |