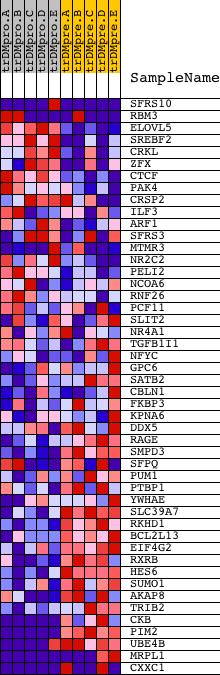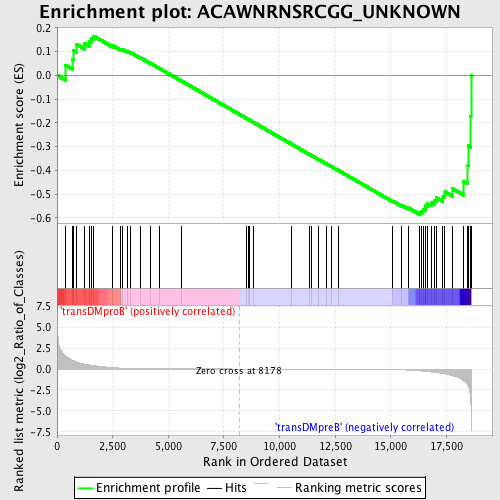
Profile of the Running ES Score & Positions of GeneSet Members on the Rank Ordered List
| Dataset | Set_04_transDMproB_versus_transDMpreB.phenotype_transDMproB_versus_transDMpreB.cls #transDMproB_versus_transDMpreB.phenotype_transDMproB_versus_transDMpreB.cls #transDMproB_versus_transDMpreB_repos |
| Phenotype | phenotype_transDMproB_versus_transDMpreB.cls#transDMproB_versus_transDMpreB_repos |
| Upregulated in class | transDMpreB |
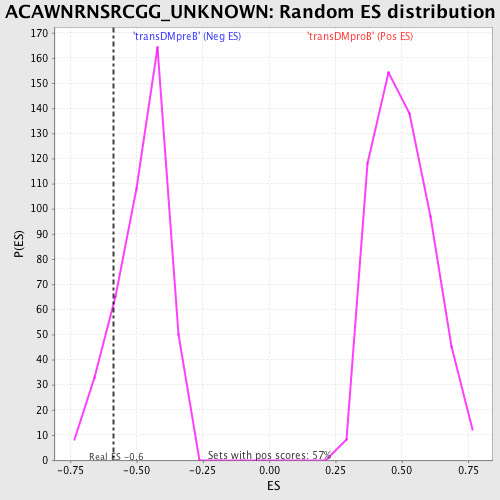
| GeneSet | ACAWNRNSRCGG_UNKNOWN |
| Enrichment Score (ES) | -0.58525306 |
| Normalized Enrichment Score (NES) | -1.2186979 |
| Nominal p-value | 0.1588785 |
| FDR q-value | 0.70682186 |
| FWER p-Value | 1.0 |
| PROBE | DESCRIPTION (from dataset) | GENE SYMBOL | GENE_TITLE | RANK IN GENE LIST | RANK METRIC SCORE | RUNNING ES | CORE ENRICHMENT | |
|---|---|---|---|---|---|---|---|---|
| 1 | SFRS10 | 9818 1722 5441 | 368 | 1.583 | 0.0435 | No | ||
| 2 | RBM3 | 5366 2625 | 690 | 1.034 | 0.0675 | No | ||
| 3 | ELOVL5 | 19373 | 735 | 0.979 | 0.1043 | No | ||
| 4 | SREBF2 | 5509 | 887 | 0.839 | 0.1297 | No | ||
| 5 | CRKL | 4560 | 1245 | 0.572 | 0.1333 | No | ||
| 6 | ZFX | 5984 | 1438 | 0.487 | 0.1424 | No | ||
| 7 | CTCF | 18490 | 1551 | 0.438 | 0.1539 | No | ||
| 8 | PAK4 | 17909 | 1643 | 0.400 | 0.1650 | No | ||
| 9 | CRSP2 | 11223 | 2503 | 0.161 | 0.1252 | No | ||
| 10 | ILF3 | 3110 3030 9176 | 2862 | 0.105 | 0.1101 | No | ||
| 11 | ARF1 | 64 | 2956 | 0.095 | 0.1089 | No | ||
| 12 | SFRS3 | 5428 23312 | 3158 | 0.076 | 0.1011 | No | ||
| 13 | MTMR3 | 7908 13193 | 3296 | 0.063 | 0.0962 | No | ||
| 14 | NR2C2 | 10216 | 3754 | 0.038 | 0.0731 | No | ||
| 15 | PELI2 | 8217 | 4180 | 0.024 | 0.0512 | No | ||
| 16 | NCOA6 | 2876 14382 | 4596 | 0.016 | 0.0295 | No | ||
| 17 | RNF26 | 5614 | 5575 | 0.008 | -0.0229 | No | ||
| 18 | PCF11 | 121 | 8517 | -0.001 | -0.1812 | No | ||
| 19 | SLIT2 | 5456 | 8619 | -0.001 | -0.1866 | No | ||
| 20 | NR4A1 | 9099 | 8658 | -0.001 | -0.1886 | No | ||
| 21 | TGFB1I1 | 5742 10159 | 8828 | -0.002 | -0.1977 | No | ||
| 22 | NFYC | 9460 | 10522 | -0.006 | -0.2886 | No | ||
| 23 | GPC6 | 21937 | 11324 | -0.008 | -0.3314 | No | ||
| 24 | SATB2 | 5604 | 11417 | -0.009 | -0.3360 | No | ||
| 25 | CBLN1 | 18800 | 11741 | -0.010 | -0.3530 | No | ||
| 26 | FKBP3 | 21056 | 12087 | -0.012 | -0.3711 | No | ||
| 27 | KPNA6 | 4972 | 12345 | -0.013 | -0.3845 | No | ||
| 28 | DDX5 | 4606 8843 4607 | 12656 | -0.015 | -0.4005 | No | ||
| 29 | RAGE | 6465 2056 2165 | 15091 | -0.066 | -0.5290 | No | ||
| 30 | SMPD3 | 18757 | 15482 | -0.093 | -0.5463 | No | ||
| 31 | SFPQ | 12936 | 15789 | -0.127 | -0.5577 | No | ||
| 32 | PUM1 | 8160 | 16302 | -0.218 | -0.5765 | Yes | ||
| 33 | PTBP1 | 5303 | 16386 | -0.238 | -0.5715 | Yes | ||
| 34 | YWHAE | 20776 | 16449 | -0.254 | -0.5647 | Yes | ||
| 35 | SLC39A7 | 23022 | 16543 | -0.280 | -0.5585 | Yes | ||
| 36 | RKHD1 | 10693 | 16550 | -0.281 | -0.5475 | Yes | ||
| 37 | BCL2L13 | 17302 | 16660 | -0.311 | -0.5410 | Yes | ||
| 38 | EIF4G2 | 1908 8892 | 16813 | -0.350 | -0.5352 | Yes | ||
| 39 | RXRB | 23285 9768 | 16942 | -0.389 | -0.5265 | Yes | ||
| 40 | HES6 | 13882 4058 | 17052 | -0.428 | -0.5153 | Yes | ||
| 41 | SUMO1 | 5826 3943 10247 | 17344 | -0.548 | -0.5091 | Yes | ||
| 42 | AKAP8 | 12121 | 17434 | -0.591 | -0.4903 | Yes | ||
| 43 | TRIB2 | 21102 | 17771 | -0.796 | -0.4766 | Yes | ||
| 44 | CKB | 4523 | 18284 | -1.424 | -0.4472 | Yes | ||
| 45 | PIM2 | 5249 9564 9565 | 18466 | -1.973 | -0.3781 | Yes | ||
| 46 | UBE4B | 2433 15672 | 18482 | -2.063 | -0.2964 | Yes | ||
| 47 | MRPL1 | 493 13572 8233 | 18580 | -3.199 | -0.1738 | Yes | ||
| 48 | CXXC1 | 1953 23519 | 18604 | -4.394 | 0.0006 | Yes |