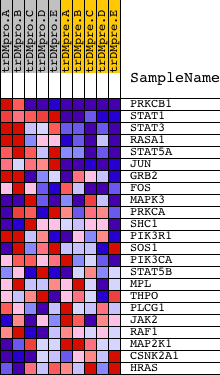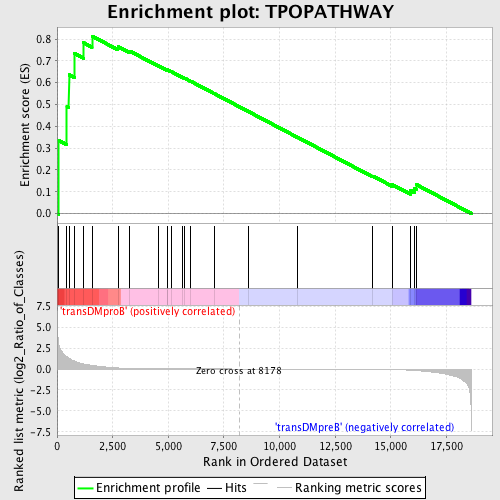
Profile of the Running ES Score & Positions of GeneSet Members on the Rank Ordered List
| Dataset | Set_04_transDMproB_versus_transDMpreB.phenotype_transDMproB_versus_transDMpreB.cls #transDMproB_versus_transDMpreB.phenotype_transDMproB_versus_transDMpreB.cls #transDMproB_versus_transDMpreB_repos |
| Phenotype | phenotype_transDMproB_versus_transDMpreB.cls#transDMproB_versus_transDMpreB_repos |
| Upregulated in class | transDMproB |
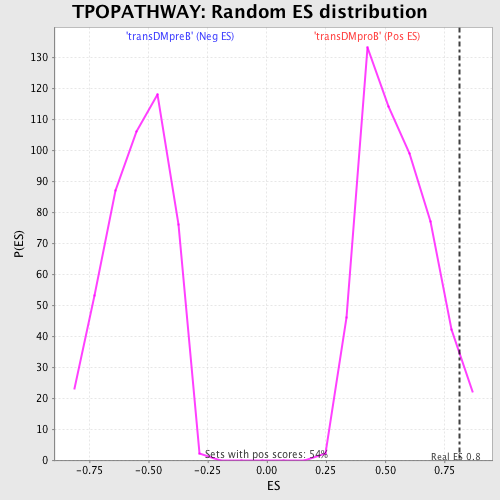
| GeneSet | TPOPATHWAY |
| Enrichment Score (ES) | 0.8135371 |
| Normalized Enrichment Score (NES) | 1.4711411 |
| Nominal p-value | 0.04485981 |
| FDR q-value | 0.2634666 |
| FWER p-Value | 0.974 |
| PROBE | DESCRIPTION (from dataset) | GENE SYMBOL | GENE_TITLE | RANK IN GENE LIST | RANK METRIC SCORE | RUNNING ES | CORE ENRICHMENT | |
|---|---|---|---|---|---|---|---|---|
| 1 | PRKCB1 | 1693 9574 | 81 | 2.858 | 0.3349 | Yes | ||
| 2 | STAT1 | 3936 5524 | 443 | 1.477 | 0.4908 | Yes | ||
| 3 | STAT3 | 5525 9906 | 534 | 1.263 | 0.6358 | Yes | ||
| 4 | RASA1 | 10174 | 782 | 0.936 | 0.7336 | Yes | ||
| 5 | STAT5A | 20664 | 1181 | 0.601 | 0.7836 | Yes | ||
| 6 | JUN | 15832 | 1569 | 0.428 | 0.8135 | Yes | ||
| 7 | GRB2 | 20149 | 2736 | 0.123 | 0.7655 | No | ||
| 8 | FOS | 21202 | 3267 | 0.066 | 0.7448 | No | ||
| 9 | MAPK3 | 6458 11170 | 4552 | 0.016 | 0.6777 | No | ||
| 10 | PRKCA | 20174 | 4949 | 0.012 | 0.6578 | No | ||
| 11 | SHC1 | 9813 9812 5430 | 4950 | 0.012 | 0.6593 | No | ||
| 12 | PIK3R1 | 3170 | 5127 | 0.011 | 0.6511 | No | ||
| 13 | SOS1 | 5476 | 5657 | 0.008 | 0.6235 | No | ||
| 14 | PIK3CA | 9562 | 5742 | 0.007 | 0.6199 | No | ||
| 15 | STAT5B | 20222 | 5994 | 0.006 | 0.6071 | No | ||
| 16 | MPL | 15780 | 7071 | 0.003 | 0.5496 | No | ||
| 17 | THPO | 22636 | 8587 | -0.001 | 0.4682 | No | ||
| 18 | PLCG1 | 14753 | 10822 | -0.007 | 0.3489 | No | ||
| 19 | JAK2 | 23893 9197 3706 | 14194 | -0.034 | 0.1717 | No | ||
| 20 | RAF1 | 17035 | 15064 | -0.065 | 0.1326 | No | ||
| 21 | MAP2K1 | 19082 | 15878 | -0.140 | 0.1055 | No | ||
| 22 | CSNK2A1 | 14797 | 16052 | -0.167 | 0.1160 | No | ||
| 23 | HRAS | 4868 | 16140 | -0.184 | 0.1332 | No |