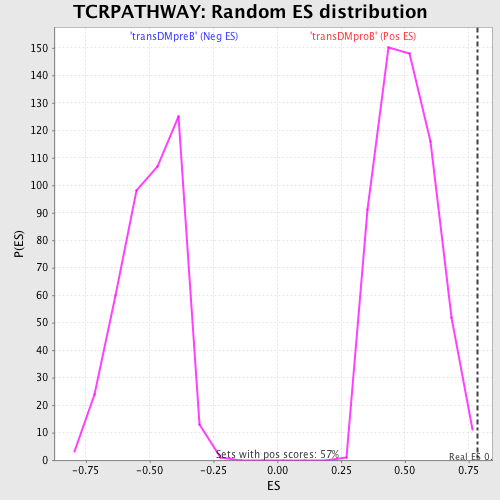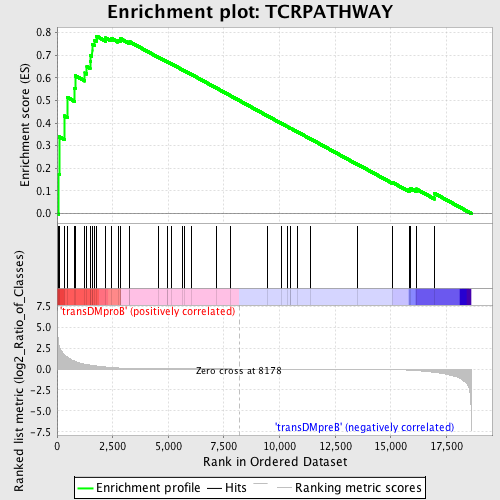
Profile of the Running ES Score & Positions of GeneSet Members on the Rank Ordered List
| Dataset | Set_04_transDMproB_versus_transDMpreB.phenotype_transDMproB_versus_transDMpreB.cls #transDMproB_versus_transDMpreB.phenotype_transDMproB_versus_transDMpreB.cls #transDMproB_versus_transDMpreB_repos |
| Phenotype | phenotype_transDMproB_versus_transDMpreB.cls#transDMproB_versus_transDMpreB_repos |
| Upregulated in class | transDMproB |
| GeneSet | TCRPATHWAY |
| Enrichment Score (ES) | 0.78456974 |
| Normalized Enrichment Score (NES) | 1.5516838 |
| Nominal p-value | 0.0017574693 |
| FDR q-value | 0.43003637 |
| FWER p-Value | 0.512 |
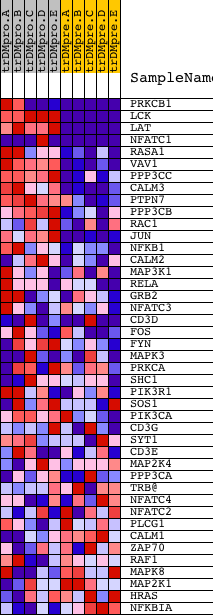
| PROBE | DESCRIPTION (from dataset) | GENE SYMBOL | GENE_TITLE | RANK IN GENE LIST | RANK METRIC SCORE | RUNNING ES | CORE ENRICHMENT | |
|---|---|---|---|---|---|---|---|---|
| 1 | PRKCB1 | 1693 9574 | 81 | 2.858 | 0.1743 | Yes | ||
| 2 | LCK | 15746 | 101 | 2.651 | 0.3390 | Yes | ||
| 3 | LAT | 17643 | 323 | 1.671 | 0.4315 | Yes | ||
| 4 | NFATC1 | 23398 1999 5167 9455 1985 1957 | 464 | 1.425 | 0.5131 | Yes | ||
| 5 | RASA1 | 10174 | 782 | 0.936 | 0.5546 | Yes | ||
| 6 | VAV1 | 23173 | 813 | 0.905 | 0.6095 | Yes | ||
| 7 | PPP3CC | 21763 | 1251 | 0.569 | 0.6215 | Yes | ||
| 8 | CALM3 | 8682 | 1340 | 0.528 | 0.6498 | Yes | ||
| 9 | PTPN7 | 11500 | 1482 | 0.468 | 0.6715 | Yes | ||
| 10 | PPP3CB | 5285 | 1499 | 0.461 | 0.6995 | Yes | ||
| 11 | RAC1 | 16302 | 1568 | 0.428 | 0.7226 | Yes | ||
| 12 | JUN | 15832 | 1569 | 0.428 | 0.7493 | Yes | ||
| 13 | NFKB1 | 15160 | 1695 | 0.381 | 0.7664 | Yes | ||
| 14 | CALM2 | 8681 | 1771 | 0.355 | 0.7846 | Yes | ||
| 15 | MAP3K1 | 21348 | 2190 | 0.232 | 0.7766 | No | ||
| 16 | RELA | 23783 | 2432 | 0.175 | 0.7746 | No | ||
| 17 | GRB2 | 20149 | 2736 | 0.123 | 0.7660 | No | ||
| 18 | NFATC3 | 5169 | 2840 | 0.108 | 0.7672 | No | ||
| 19 | CD3D | 19473 | 2843 | 0.107 | 0.7738 | No | ||
| 20 | FOS | 21202 | 3267 | 0.066 | 0.7551 | No | ||
| 21 | FYN | 3375 3395 20052 | 3271 | 0.066 | 0.7590 | No | ||
| 22 | MAPK3 | 6458 11170 | 4552 | 0.016 | 0.6912 | No | ||
| 23 | PRKCA | 20174 | 4949 | 0.012 | 0.6706 | No | ||
| 24 | SHC1 | 9813 9812 5430 | 4950 | 0.012 | 0.6714 | No | ||
| 25 | PIK3R1 | 3170 | 5127 | 0.011 | 0.6626 | No | ||
| 26 | SOS1 | 5476 | 5657 | 0.008 | 0.6346 | No | ||
| 27 | PIK3CA | 9562 | 5742 | 0.007 | 0.6305 | No | ||
| 28 | CD3G | 19139 | 6019 | 0.006 | 0.6160 | No | ||
| 29 | SYT1 | 5565 | 7163 | 0.003 | 0.5546 | No | ||
| 30 | CD3E | 8714 | 7772 | 0.001 | 0.5220 | No | ||
| 31 | MAP2K4 | 20405 | 9477 | -0.003 | 0.4304 | No | ||
| 32 | PPP3CA | 1863 5284 | 10074 | -0.004 | 0.3986 | No | ||
| 33 | TRB@ | 1157 | 10348 | -0.005 | 0.3842 | No | ||
| 34 | NFATC4 | 22002 | 10475 | -0.006 | 0.3778 | No | ||
| 35 | NFATC2 | 5168 2866 | 10494 | -0.006 | 0.3772 | No | ||
| 36 | PLCG1 | 14753 | 10822 | -0.007 | 0.3600 | No | ||
| 37 | CALM1 | 21184 | 11378 | -0.008 | 0.3306 | No | ||
| 38 | ZAP70 | 14271 4042 | 13496 | -0.022 | 0.2181 | No | ||
| 39 | RAF1 | 17035 | 15064 | -0.065 | 0.1377 | No | ||
| 40 | MAPK8 | 6459 | 15826 | -0.132 | 0.1050 | No | ||
| 41 | MAP2K1 | 19082 | 15878 | -0.140 | 0.1110 | No | ||
| 42 | HRAS | 4868 | 16140 | -0.184 | 0.1085 | No | ||
| 43 | NFKBIA | 21065 | 16968 | -0.396 | 0.0887 | No |