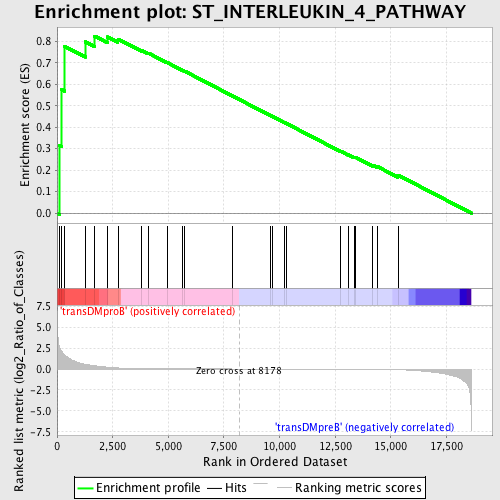
Profile of the Running ES Score & Positions of GeneSet Members on the Rank Ordered List
| Dataset | Set_04_transDMproB_versus_transDMpreB.phenotype_transDMproB_versus_transDMpreB.cls #transDMproB_versus_transDMpreB.phenotype_transDMproB_versus_transDMpreB.cls #transDMproB_versus_transDMpreB_repos |
| Phenotype | phenotype_transDMproB_versus_transDMpreB.cls#transDMproB_versus_transDMpreB_repos |
| Upregulated in class | transDMproB |
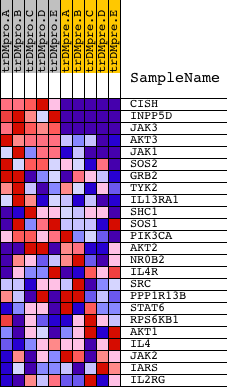
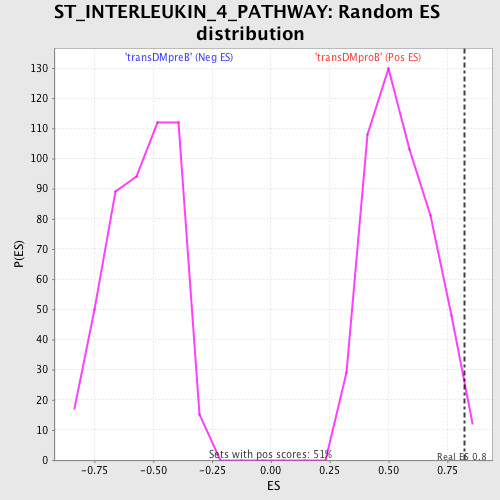
| GeneSet | ST_INTERLEUKIN_4_PATHWAY |
| Enrichment Score (ES) | 0.8241148 |
| Normalized Enrichment Score (NES) | 1.5066439 |
| Nominal p-value | 0.017612524 |
| FDR q-value | 0.22839011 |
| FWER p-Value | 0.851 |
| PROBE | DESCRIPTION (from dataset) | GENE SYMBOL | GENE_TITLE | RANK IN GENE LIST | RANK METRIC SCORE | RUNNING ES | CORE ENRICHMENT | |
|---|---|---|---|---|---|---|---|---|
| 1 | CISH | 8743 | 117 | 2.535 | 0.3153 | Yes | ||
| 2 | INPP5D | 14198 | 207 | 2.080 | 0.5745 | Yes | ||
| 3 | JAK3 | 9198 4936 | 338 | 1.648 | 0.7765 | Yes | ||
| 4 | AKT3 | 13739 982 | 1267 | 0.562 | 0.7979 | Yes | ||
| 5 | JAK1 | 15827 | 1686 | 0.384 | 0.8241 | Yes | ||
| 6 | SOS2 | 21049 | 2262 | 0.214 | 0.8203 | No | ||
| 7 | GRB2 | 20149 | 2736 | 0.123 | 0.8105 | No | ||
| 8 | TYK2 | 12058 19215 | 3787 | 0.036 | 0.7587 | No | ||
| 9 | IL13RA1 | 24361 | 4107 | 0.026 | 0.7448 | No | ||
| 10 | SHC1 | 9813 9812 5430 | 4950 | 0.012 | 0.7010 | No | ||
| 11 | SOS1 | 5476 | 5657 | 0.008 | 0.6640 | No | ||
| 12 | PIK3CA | 9562 | 5742 | 0.007 | 0.6604 | No | ||
| 13 | AKT2 | 4365 4366 | 7867 | 0.001 | 0.5463 | No | ||
| 14 | NR0B2 | 16050 | 9570 | -0.003 | 0.4552 | No | ||
| 15 | IL4R | 18085 | 9679 | -0.003 | 0.4498 | No | ||
| 16 | SRC | 5507 | 10223 | -0.005 | 0.4212 | No | ||
| 17 | PPP1R13B | 10211 20980 | 10295 | -0.005 | 0.4180 | No | ||
| 18 | STAT6 | 19854 9909 | 12728 | -0.015 | 0.2892 | No | ||
| 19 | RPS6KB1 | 7815 1207 13040 | 13079 | -0.018 | 0.2727 | No | ||
| 20 | AKT1 | 8568 | 13355 | -0.021 | 0.2605 | No | ||
| 21 | IL4 | 9174 | 13402 | -0.021 | 0.2607 | No | ||
| 22 | JAK2 | 23893 9197 3706 | 14194 | -0.034 | 0.2225 | No | ||
| 23 | IARS | 4190 8361 8362 | 14413 | -0.040 | 0.2159 | No | ||
| 24 | IL2RG | 24096 | 15322 | -0.080 | 0.1772 | No |