Profile of the Running ES Score & Positions of GeneSet Members on the Rank Ordered List
| Dataset | Set_04_transDMproB_versus_transDMpreB.phenotype_transDMproB_versus_transDMpreB.cls #transDMproB_versus_transDMpreB.phenotype_transDMproB_versus_transDMpreB.cls #transDMproB_versus_transDMpreB_repos |
| Phenotype | phenotype_transDMproB_versus_transDMpreB.cls#transDMproB_versus_transDMpreB_repos |
| Upregulated in class | transDMpreB |
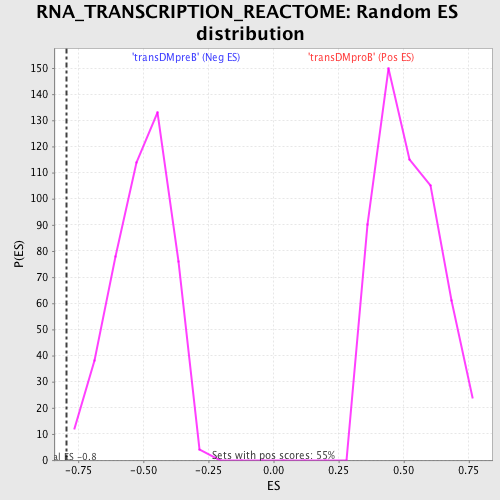
| GeneSet | RNA_TRANSCRIPTION_REACTOME |
| Enrichment Score (ES) | -0.7935878 |
| Normalized Enrichment Score (NES) | -1.5691164 |
| Nominal p-value | 0.0021978023 |
| FDR q-value | 0.46489984 |
| FWER p-Value | 0.448 |
| PROBE | DESCRIPTION (from dataset) | GENE SYMBOL | GENE_TITLE | RANK IN GENE LIST | RANK METRIC SCORE | RUNNING ES | CORE ENRICHMENT | |
|---|---|---|---|---|---|---|---|---|
| 1 | TAF12 | 2537 16058 2338 | 740 | 0.975 | 0.0143 | No | ||
| 2 | GTF2B | 10489 | 3509 | 0.049 | -0.1319 | No | ||
| 3 | TAF13 | 8288 | 3542 | 0.047 | -0.1310 | No | ||
| 4 | POLR2I | 12839 | 4549 | 0.016 | -0.1843 | No | ||
| 5 | TAF7 | 6287 1968 | 7033 | 0.003 | -0.3177 | No | ||
| 6 | ILK | 9177 1618 | 7630 | 0.001 | -0.3497 | No | ||
| 7 | TAF9 | 3213 8433 | 8410 | -0.001 | -0.3916 | No | ||
| 8 | POLR2B | 16817 | 9559 | -0.003 | -0.4532 | No | ||
| 9 | POLR3K | 12447 7372 | 10058 | -0.004 | -0.4798 | No | ||
| 10 | POLR2C | 9750 | 11129 | -0.008 | -0.5369 | No | ||
| 11 | CDK7 | 21365 | 11610 | -0.009 | -0.5622 | No | ||
| 12 | GTF2A2 | 10654 | 11981 | -0.011 | -0.5815 | No | ||
| 13 | GTF2H1 | 4069 18236 | 12236 | -0.012 | -0.5945 | No | ||
| 14 | POLR3D | 21760 12456 | 13481 | -0.022 | -0.6602 | No | ||
| 15 | MNAT1 | 9396 2161 | 14660 | -0.047 | -0.7210 | No | ||
| 16 | TAF5 | 23833 5934 3759 | 15238 | -0.076 | -0.7479 | No | ||
| 17 | POLR2A | 5394 | 15899 | -0.143 | -0.7755 | No | ||
| 18 | POLR1A | 9749 5393 | 16180 | -0.192 | -0.7799 | Yes | ||
| 19 | GTF2E1 | 22597 | 16435 | -0.251 | -0.7797 | Yes | ||
| 20 | TAF6 | 16322 891 | 16541 | -0.279 | -0.7698 | Yes | ||
| 21 | ERCC3 | 23605 | 16551 | -0.282 | -0.7547 | Yes | ||
| 22 | GTF2E2 | 18635 | 16599 | -0.293 | -0.7410 | Yes | ||
| 23 | POLR2G | 23753 | 17011 | -0.414 | -0.7401 | Yes | ||
| 24 | POLR2K | 9413 | 17083 | -0.439 | -0.7196 | Yes | ||
| 25 | POLR2J | 16672 | 17332 | -0.543 | -0.7028 | Yes | ||
| 26 | GTF2H2 | 6236 | 17831 | -0.841 | -0.6829 | Yes | ||
| 27 | GTF2H4 | 22999 | 17871 | -0.869 | -0.6367 | Yes | ||
| 28 | POLR2H | 10888 | 18041 | -1.027 | -0.5888 | Yes | ||
| 29 | TBP | 671 1554 | 18119 | -1.131 | -0.5302 | Yes | ||
| 30 | GTF2F2 | 21750 | 18128 | -1.139 | -0.4674 | Yes | ||
| 31 | POLR3E | 18100 | 18132 | -1.141 | -0.4042 | Yes | ||
| 32 | POLR3B | 12875 | 18305 | -1.460 | -0.3325 | Yes | ||
| 33 | POLR3H | 13460 8135 | 18318 | -1.488 | -0.2505 | Yes | ||
| 34 | POLR1B | 14857 | 18521 | -2.309 | -0.1332 | Yes | ||
| 35 | POLR2E | 3325 19699 | 18536 | -2.490 | 0.0043 | Yes |