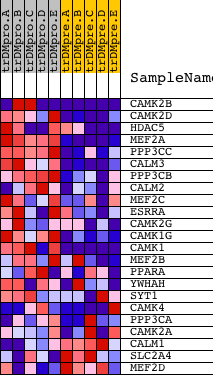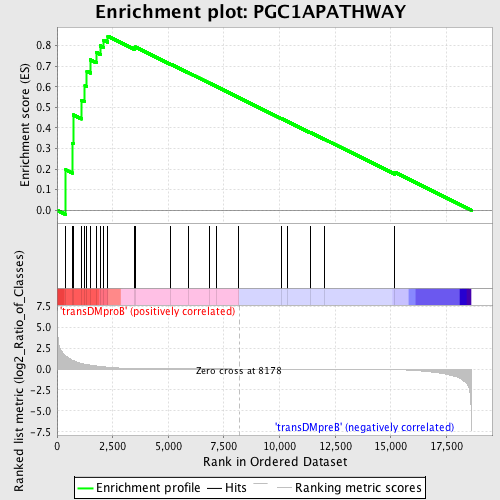
Profile of the Running ES Score & Positions of GeneSet Members on the Rank Ordered List
| Dataset | Set_04_transDMproB_versus_transDMpreB.phenotype_transDMproB_versus_transDMpreB.cls #transDMproB_versus_transDMpreB.phenotype_transDMproB_versus_transDMpreB.cls #transDMproB_versus_transDMpreB_repos |
| Phenotype | phenotype_transDMproB_versus_transDMpreB.cls#transDMproB_versus_transDMpreB_repos |
| Upregulated in class | transDMproB |
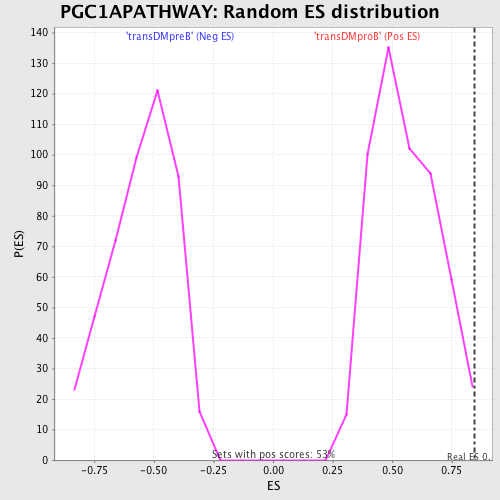
| GeneSet | PGC1APATHWAY |
| Enrichment Score (ES) | 0.84656173 |
| Normalized Enrichment Score (NES) | 1.5203007 |
| Nominal p-value | 0.0037807184 |
| FDR q-value | 0.19342628 |
| FWER p-Value | 0.779 |
| PROBE | DESCRIPTION (from dataset) | GENE SYMBOL | GENE_TITLE | RANK IN GENE LIST | RANK METRIC SCORE | RUNNING ES | CORE ENRICHMENT | |
|---|---|---|---|---|---|---|---|---|
| 1 | CAMK2B | 20536 | 391 | 1.552 | 0.1958 | Yes | ||
| 2 | CAMK2D | 4232 | 680 | 1.045 | 0.3264 | Yes | ||
| 3 | HDAC5 | 1480 20205 | 723 | 0.996 | 0.4633 | Yes | ||
| 4 | MEF2A | 1201 5089 3492 | 1095 | 0.656 | 0.5351 | Yes | ||
| 5 | PPP3CC | 21763 | 1251 | 0.569 | 0.6062 | Yes | ||
| 6 | CALM3 | 8682 | 1340 | 0.528 | 0.6754 | Yes | ||
| 7 | PPP3CB | 5285 | 1499 | 0.461 | 0.7313 | Yes | ||
| 8 | CALM2 | 8681 | 1771 | 0.355 | 0.7664 | Yes | ||
| 9 | MEF2C | 3204 9378 | 1945 | 0.302 | 0.7992 | Yes | ||
| 10 | ESRRA | 23802 | 2097 | 0.258 | 0.8272 | Yes | ||
| 11 | CAMK2G | 21905 | 2283 | 0.210 | 0.8466 | Yes | ||
| 12 | CAMK1G | 13710 4129 | 3483 | 0.051 | 0.7892 | No | ||
| 13 | CAMK1 | 1037 1170 17044 | 3520 | 0.048 | 0.7940 | No | ||
| 14 | MEF2B | 9377 | 5115 | 0.011 | 0.7098 | No | ||
| 15 | PPARA | 22397 | 5902 | 0.007 | 0.6684 | No | ||
| 16 | YWHAH | 5937 10368 | 6860 | 0.003 | 0.6175 | No | ||
| 17 | SYT1 | 5565 | 7163 | 0.003 | 0.6016 | No | ||
| 18 | CAMK4 | 4473 | 8169 | 0.000 | 0.5475 | No | ||
| 19 | PPP3CA | 1863 5284 | 10074 | -0.004 | 0.4458 | No | ||
| 20 | CAMK2A | 2024 23541 1980 | 10341 | -0.005 | 0.4322 | No | ||
| 21 | CALM1 | 21184 | 11378 | -0.008 | 0.3776 | No | ||
| 22 | SLC2A4 | 20380 | 12021 | -0.011 | 0.3447 | No | ||
| 23 | MEF2D | 9379 | 15172 | -0.071 | 0.1852 | No |