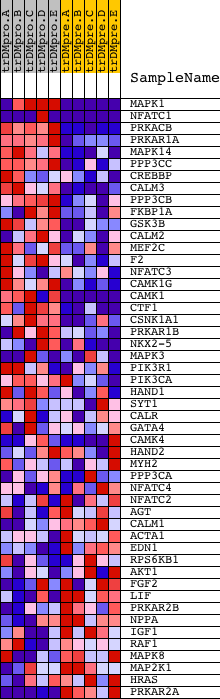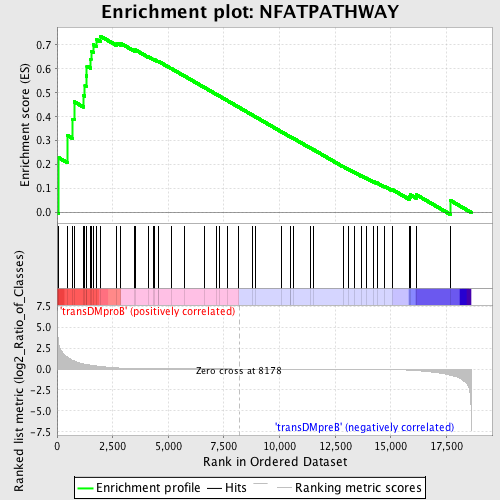
Profile of the Running ES Score & Positions of GeneSet Members on the Rank Ordered List
| Dataset | Set_04_transDMproB_versus_transDMpreB.phenotype_transDMproB_versus_transDMpreB.cls #transDMproB_versus_transDMpreB.phenotype_transDMproB_versus_transDMpreB.cls #transDMproB_versus_transDMpreB_repos |
| Phenotype | phenotype_transDMproB_versus_transDMpreB.cls#transDMproB_versus_transDMpreB_repos |
| Upregulated in class | transDMproB |
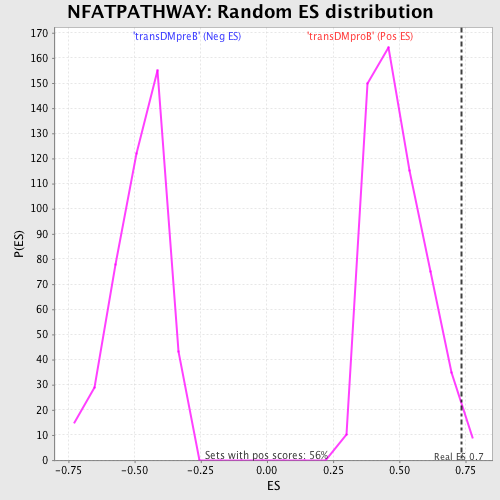
| GeneSet | NFATPATHWAY |
| Enrichment Score (ES) | 0.73665243 |
| Normalized Enrichment Score (NES) | 1.5017151 |
| Nominal p-value | 0.014336918 |
| FDR q-value | 0.19614165 |
| FWER p-Value | 0.877 |
| PROBE | DESCRIPTION (from dataset) | GENE SYMBOL | GENE_TITLE | RANK IN GENE LIST | RANK METRIC SCORE | RUNNING ES | CORE ENRICHMENT | |
|---|---|---|---|---|---|---|---|---|
| 1 | MAPK1 | 1642 11167 | 80 | 2.911 | 0.2286 | Yes | ||
| 2 | NFATC1 | 23398 1999 5167 9455 1985 1957 | 464 | 1.425 | 0.3220 | Yes | ||
| 3 | PRKACB | 15140 | 705 | 1.014 | 0.3901 | Yes | ||
| 4 | PRKAR1A | 20615 | 770 | 0.949 | 0.4626 | Yes | ||
| 5 | MAPK14 | 23313 | 1184 | 0.600 | 0.4884 | Yes | ||
| 6 | PPP3CC | 21763 | 1251 | 0.569 | 0.5303 | Yes | ||
| 7 | CREBBP | 22682 8783 | 1308 | 0.542 | 0.5707 | Yes | ||
| 8 | CALM3 | 8682 | 1340 | 0.528 | 0.6113 | Yes | ||
| 9 | PPP3CB | 5285 | 1499 | 0.461 | 0.6397 | Yes | ||
| 10 | FKBP1A | 2801 | 1527 | 0.449 | 0.6742 | Yes | ||
| 11 | GSK3B | 22761 | 1631 | 0.404 | 0.7009 | Yes | ||
| 12 | CALM2 | 8681 | 1771 | 0.355 | 0.7218 | Yes | ||
| 13 | MEF2C | 3204 9378 | 1945 | 0.302 | 0.7367 | Yes | ||
| 14 | F2 | 14524 | 2685 | 0.132 | 0.7074 | No | ||
| 15 | NFATC3 | 5169 | 2840 | 0.108 | 0.7077 | No | ||
| 16 | CAMK1G | 13710 4129 | 3483 | 0.051 | 0.6772 | No | ||
| 17 | CAMK1 | 1037 1170 17044 | 3520 | 0.048 | 0.6791 | No | ||
| 18 | CTF1 | 18064 | 4095 | 0.026 | 0.6503 | No | ||
| 19 | CSNK1A1 | 8204 | 4343 | 0.020 | 0.6386 | No | ||
| 20 | PRKAR1B | 16320 | 4389 | 0.019 | 0.6377 | No | ||
| 21 | NKX2-5 | 23060 | 4548 | 0.016 | 0.6305 | No | ||
| 22 | MAPK3 | 6458 11170 | 4552 | 0.016 | 0.6317 | No | ||
| 23 | PIK3R1 | 3170 | 5127 | 0.011 | 0.6016 | No | ||
| 24 | PIK3CA | 9562 | 5742 | 0.007 | 0.5691 | No | ||
| 25 | HAND1 | 20440 | 6608 | 0.004 | 0.5229 | No | ||
| 26 | SYT1 | 5565 | 7163 | 0.003 | 0.4932 | No | ||
| 27 | CALR | 18814 | 7309 | 0.002 | 0.4856 | No | ||
| 28 | GATA4 | 21792 4755 | 7652 | 0.001 | 0.4673 | No | ||
| 29 | CAMK4 | 4473 | 8169 | 0.000 | 0.4395 | No | ||
| 30 | HAND2 | 18615 | 8794 | -0.001 | 0.4060 | No | ||
| 31 | MYH2 | 20838 | 8935 | -0.002 | 0.3986 | No | ||
| 32 | PPP3CA | 1863 5284 | 10074 | -0.004 | 0.3377 | No | ||
| 33 | NFATC4 | 22002 | 10475 | -0.006 | 0.3166 | No | ||
| 34 | NFATC2 | 5168 2866 | 10494 | -0.006 | 0.3161 | No | ||
| 35 | AGT | 18711 | 10634 | -0.006 | 0.3090 | No | ||
| 36 | CALM1 | 21184 | 11378 | -0.008 | 0.2697 | No | ||
| 37 | ACTA1 | 18715 | 11541 | -0.009 | 0.2617 | No | ||
| 38 | EDN1 | 21658 | 12864 | -0.016 | 0.1918 | No | ||
| 39 | RPS6KB1 | 7815 1207 13040 | 13079 | -0.018 | 0.1818 | No | ||
| 40 | AKT1 | 8568 | 13355 | -0.021 | 0.1686 | No | ||
| 41 | FGF2 | 15608 | 13664 | -0.025 | 0.1540 | No | ||
| 42 | LIF | 956 667 20960 | 13887 | -0.028 | 0.1443 | No | ||
| 43 | PRKAR2B | 5288 2107 | 14236 | -0.035 | 0.1284 | No | ||
| 44 | NPPA | 298 | 14382 | -0.039 | 0.1237 | No | ||
| 45 | IGF1 | 3352 9156 3409 | 14702 | -0.048 | 0.1104 | No | ||
| 46 | RAF1 | 17035 | 15064 | -0.065 | 0.0961 | No | ||
| 47 | MAPK8 | 6459 | 15826 | -0.132 | 0.0657 | No | ||
| 48 | MAP2K1 | 19082 | 15878 | -0.140 | 0.0741 | No | ||
| 49 | HRAS | 4868 | 16140 | -0.184 | 0.0748 | No | ||
| 50 | PRKAR2A | 5287 | 17679 | -0.732 | 0.0505 | No |