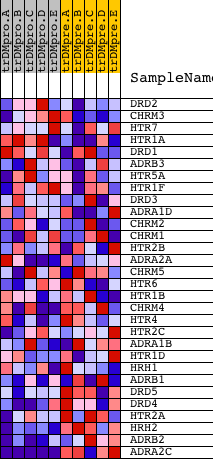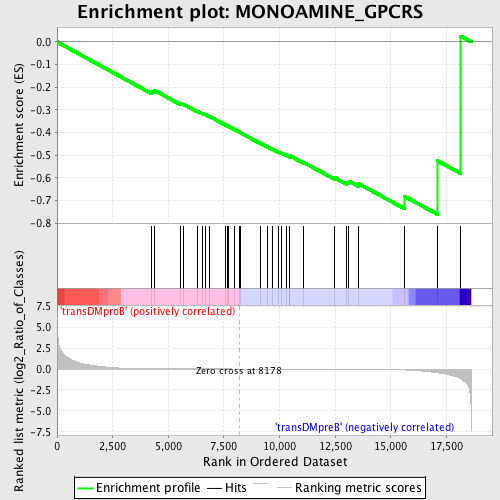
Profile of the Running ES Score & Positions of GeneSet Members on the Rank Ordered List
| Dataset | Set_04_transDMproB_versus_transDMpreB.phenotype_transDMproB_versus_transDMpreB.cls #transDMproB_versus_transDMpreB.phenotype_transDMproB_versus_transDMpreB.cls #transDMproB_versus_transDMpreB_repos |
| Phenotype | phenotype_transDMproB_versus_transDMpreB.cls#transDMproB_versus_transDMpreB_repos |
| Upregulated in class | transDMpreB |
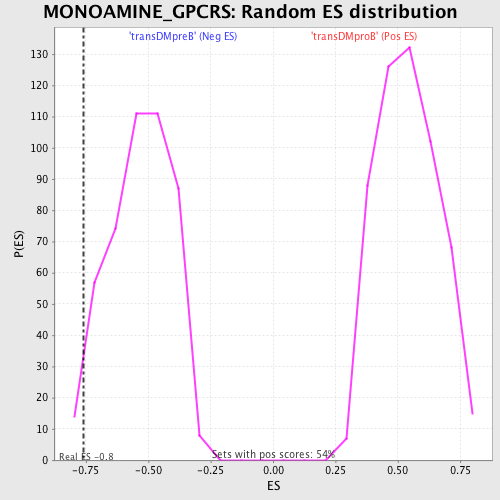
| GeneSet | MONOAMINE_GPCRS |
| Enrichment Score (ES) | -0.7616833 |
| Normalized Enrichment Score (NES) | -1.4289542 |
| Nominal p-value | 0.028138528 |
| FDR q-value | 0.4367861 |
| FWER p-Value | 1.0 |
| PROBE | DESCRIPTION (from dataset) | GENE SYMBOL | GENE_TITLE | RANK IN GENE LIST | RANK METRIC SCORE | RUNNING ES | CORE ENRICHMENT | |
|---|---|---|---|---|---|---|---|---|
| 1 | DRD2 | 19461 | 4246 | 0.022 | -0.2169 | No | ||
| 2 | CHRM3 | 21547 | 4376 | 0.019 | -0.2136 | No | ||
| 3 | HTR7 | 23690 | 5548 | 0.008 | -0.2722 | No | ||
| 4 | HTR1A | 21569 | 5660 | 0.008 | -0.2740 | No | ||
| 5 | DRD1 | 4638 | 6313 | 0.005 | -0.3064 | No | ||
| 6 | ADRB3 | 18901 | 6525 | 0.004 | -0.3154 | No | ||
| 7 | HTR5A | 16899 | 6652 | 0.004 | -0.3200 | No | ||
| 8 | HTR1F | 22562 | 6835 | 0.004 | -0.3280 | No | ||
| 9 | DRD3 | 22750 | 7579 | 0.002 | -0.3671 | No | ||
| 10 | ADRA1D | 20737 8561 | 7670 | 0.001 | -0.3713 | No | ||
| 11 | CHRM2 | 10840 | 7692 | 0.001 | -0.3717 | No | ||
| 12 | CHRM1 | 23943 | 7972 | 0.001 | -0.3865 | No | ||
| 13 | HTR2B | 13900 | 8212 | -0.000 | -0.3993 | No | ||
| 14 | ADRA2A | 4355 | 8248 | -0.000 | -0.4011 | No | ||
| 15 | CHRM5 | 10038 | 9123 | -0.002 | -0.4470 | No | ||
| 16 | HTR6 | 15698 | 9452 | -0.003 | -0.4631 | No | ||
| 17 | HTR1B | 19051 | 9669 | -0.003 | -0.4729 | No | ||
| 18 | CHRM4 | 14945 | 9970 | -0.004 | -0.4868 | No | ||
| 19 | HTR4 | 1987 4887 | 10085 | -0.004 | -0.4906 | No | ||
| 20 | HTR2C | 24230 | 10288 | -0.005 | -0.4988 | No | ||
| 21 | ADRA1B | 4354 | 10464 | -0.005 | -0.5053 | No | ||
| 22 | HTR1D | 16029 | 10467 | -0.006 | -0.5025 | No | ||
| 23 | HRH1 | 17321 | 11071 | -0.007 | -0.5311 | No | ||
| 24 | ADRB1 | 4357 | 12463 | -0.014 | -0.5987 | No | ||
| 25 | DRD5 | 16853 | 13022 | -0.018 | -0.6194 | No | ||
| 26 | DRD4 | 4639 | 13119 | -0.019 | -0.6147 | No | ||
| 27 | HTR2A | 9135 21961 | 13548 | -0.023 | -0.6255 | No | ||
| 28 | HRH2 | 9120 | 15602 | -0.104 | -0.6808 | Yes | ||
| 29 | ADRB2 | 23422 | 17107 | -0.447 | -0.5249 | Yes | ||
| 30 | ADRA2C | 16869 | 18138 | -1.145 | 0.0257 | Yes |