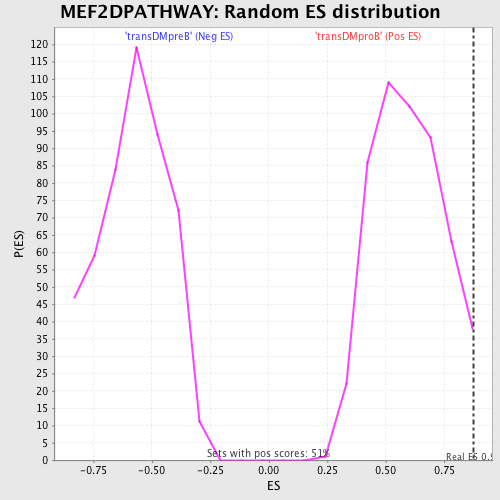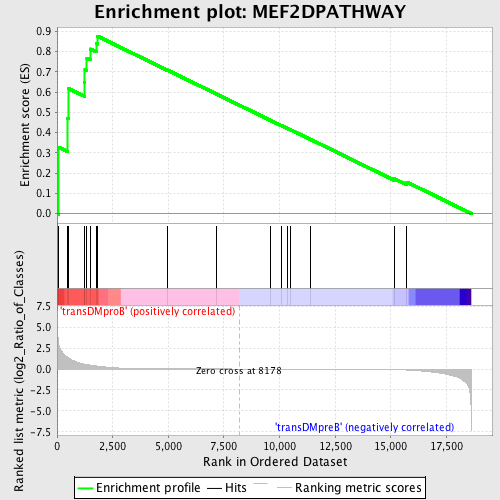
Profile of the Running ES Score & Positions of GeneSet Members on the Rank Ordered List
| Dataset | Set_04_transDMproB_versus_transDMpreB.phenotype_transDMproB_versus_transDMpreB.cls #transDMproB_versus_transDMpreB.phenotype_transDMproB_versus_transDMpreB.cls #transDMproB_versus_transDMpreB_repos |
| Phenotype | phenotype_transDMproB_versus_transDMpreB.cls#transDMproB_versus_transDMpreB_repos |
| Upregulated in class | transDMproB |
| GeneSet | MEF2DPATHWAY |
| Enrichment Score (ES) | 0.87606496 |
| Normalized Enrichment Score (NES) | 1.4661986 |
| Nominal p-value | 0.013618677 |
| FDR q-value | 0.25663123 |
| FWER p-Value | 0.981 |
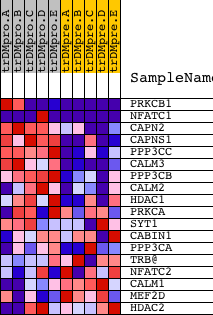
| PROBE | DESCRIPTION (from dataset) | GENE SYMBOL | GENE_TITLE | RANK IN GENE LIST | RANK METRIC SCORE | RUNNING ES | CORE ENRICHMENT | |
|---|---|---|---|---|---|---|---|---|
| 1 | PRKCB1 | 1693 9574 | 81 | 2.858 | 0.3269 | Yes | ||
| 2 | NFATC1 | 23398 1999 5167 9455 1985 1957 | 464 | 1.425 | 0.4716 | Yes | ||
| 3 | CAPN2 | 8685 4475 13731 | 523 | 1.284 | 0.6173 | Yes | ||
| 4 | CAPNS1 | 17894 | 1234 | 0.577 | 0.6460 | Yes | ||
| 5 | PPP3CC | 21763 | 1251 | 0.569 | 0.7111 | Yes | ||
| 6 | CALM3 | 8682 | 1340 | 0.528 | 0.7676 | Yes | ||
| 7 | PPP3CB | 5285 | 1499 | 0.461 | 0.8125 | Yes | ||
| 8 | CALM2 | 8681 | 1771 | 0.355 | 0.8391 | Yes | ||
| 9 | HDAC1 | 9081 | 1814 | 0.338 | 0.8761 | Yes | ||
| 10 | PRKCA | 20174 | 4949 | 0.012 | 0.7090 | No | ||
| 11 | SYT1 | 5565 | 7163 | 0.003 | 0.5903 | No | ||
| 12 | CABIN1 | 19733 | 9583 | -0.003 | 0.4606 | No | ||
| 13 | PPP3CA | 1863 5284 | 10074 | -0.004 | 0.4348 | No | ||
| 14 | TRB@ | 1157 | 10348 | -0.005 | 0.4207 | No | ||
| 15 | NFATC2 | 5168 2866 | 10494 | -0.006 | 0.4135 | No | ||
| 16 | CALM1 | 21184 | 11378 | -0.008 | 0.3670 | No | ||
| 17 | MEF2D | 9379 | 15172 | -0.071 | 0.1713 | No | ||
| 18 | HDAC2 | 20055 | 15723 | -0.119 | 0.1555 | No |