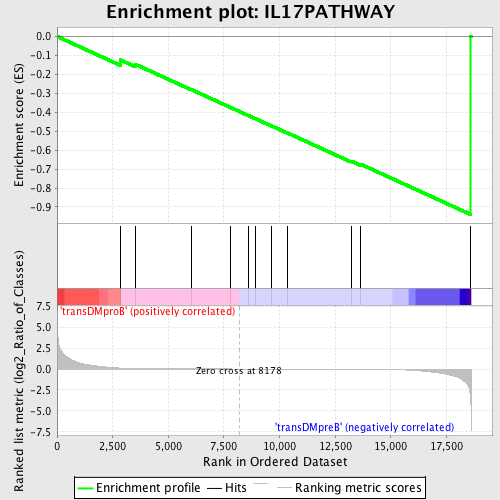
Profile of the Running ES Score & Positions of GeneSet Members on the Rank Ordered List
| Dataset | Set_04_transDMproB_versus_transDMpreB.phenotype_transDMproB_versus_transDMpreB.cls #transDMproB_versus_transDMpreB.phenotype_transDMproB_versus_transDMpreB.cls #transDMproB_versus_transDMpreB_repos |
| Phenotype | phenotype_transDMproB_versus_transDMpreB.cls#transDMproB_versus_transDMpreB_repos |
| Upregulated in class | transDMpreB |
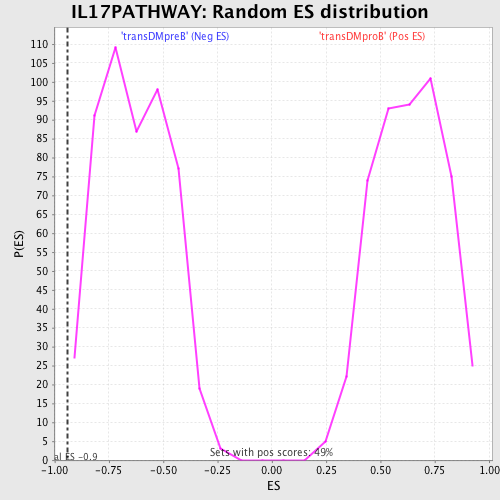
| GeneSet | IL17PATHWAY |
| Enrichment Score (ES) | -0.9396434 |
| Normalized Enrichment Score (NES) | -1.4914751 |
| Nominal p-value | 0.0058708414 |
| FDR q-value | 0.40852538 |
| FWER p-Value | 0.93 |
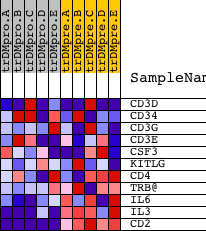
| PROBE | DESCRIPTION (from dataset) | GENE SYMBOL | GENE_TITLE | RANK IN GENE LIST | RANK METRIC SCORE | RUNNING ES | CORE ENRICHMENT | |
|---|---|---|---|---|---|---|---|---|
| 1 | CD3D | 19473 | 2843 | 0.107 | -0.1240 | No | ||
| 2 | CD34 | 14006 | 3506 | 0.049 | -0.1464 | No | ||
| 3 | CD3G | 19139 | 6019 | 0.006 | -0.2797 | No | ||
| 4 | CD3E | 8714 | 7772 | 0.001 | -0.3736 | No | ||
| 5 | CSF3 | 1394 20671 | 8594 | -0.001 | -0.4175 | No | ||
| 6 | KITLG | 19889 3342 | 8902 | -0.002 | -0.4335 | No | ||
| 7 | CD4 | 16999 | 9641 | -0.003 | -0.4723 | No | ||
| 8 | TRB@ | 1157 | 10348 | -0.005 | -0.5089 | No | ||
| 9 | IL6 | 16895 | 13211 | -0.019 | -0.6575 | No | ||
| 10 | IL3 | 20453 | 13638 | -0.025 | -0.6738 | Yes | ||
| 11 | CD2 | 15223 | 18586 | -3.506 | 0.0016 | Yes |