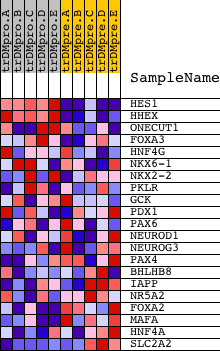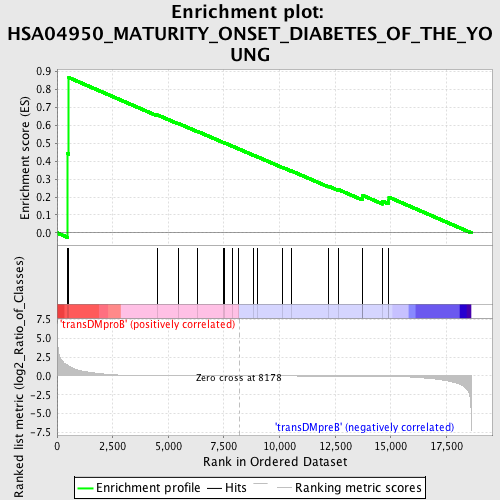
Profile of the Running ES Score & Positions of GeneSet Members on the Rank Ordered List
| Dataset | Set_04_transDMproB_versus_transDMpreB.phenotype_transDMproB_versus_transDMpreB.cls #transDMproB_versus_transDMpreB.phenotype_transDMproB_versus_transDMpreB.cls #transDMproB_versus_transDMpreB_repos |
| Phenotype | phenotype_transDMproB_versus_transDMpreB.cls#transDMproB_versus_transDMpreB_repos |
| Upregulated in class | transDMproB |
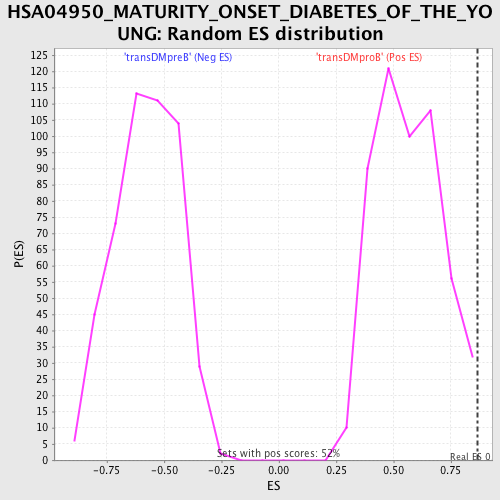
| GeneSet | HSA04950_MATURITY_ONSET_DIABETES_OF_THE_YOUNG |
| Enrichment Score (ES) | 0.867014 |
| Normalized Enrichment Score (NES) | 1.527794 |
| Nominal p-value | 0.017408123 |
| FDR q-value | 0.24448074 |
| FWER p-Value | 0.717 |
| PROBE | DESCRIPTION (from dataset) | GENE SYMBOL | GENE_TITLE | RANK IN GENE LIST | RANK METRIC SCORE | RUNNING ES | CORE ENRICHMENT | |
|---|---|---|---|---|---|---|---|---|
| 1 | HES1 | 22798 | 476 | 1.392 | 0.4420 | Yes | ||
| 2 | HHEX | 23872 | 526 | 1.273 | 0.8670 | Yes | ||
| 3 | ONECUT1 | 4858 | 4514 | 0.017 | 0.6583 | No | ||
| 4 | FOXA3 | 17949 | 5450 | 0.009 | 0.6110 | No | ||
| 5 | HNF4G | 15640 | 6294 | 0.005 | 0.5674 | No | ||
| 6 | NKX6-1 | 16463 | 7467 | 0.002 | 0.5050 | No | ||
| 7 | NKX2-2 | 5176 | 7544 | 0.002 | 0.5015 | No | ||
| 8 | PKLR | 1850 15545 | 7870 | 0.001 | 0.4843 | No | ||
| 9 | GCK | 20535 | 8153 | 0.000 | 0.4691 | No | ||
| 10 | PDX1 | 16621 | 8805 | -0.001 | 0.4346 | No | ||
| 11 | PAX6 | 5223 | 8999 | -0.002 | 0.4249 | No | ||
| 12 | NEUROD1 | 14550 | 10108 | -0.005 | 0.3668 | No | ||
| 13 | NEUROG3 | 20005 | 10514 | -0.006 | 0.3469 | No | ||
| 14 | PAX4 | 17199 | 12203 | -0.012 | 0.2602 | No | ||
| 15 | BHLHB8 | 9390 5101 12776 | 12667 | -0.015 | 0.2404 | No | ||
| 16 | IAPP | 17249 | 13721 | -0.026 | 0.1924 | No | ||
| 17 | NR5A2 | 4105 13817 | 13733 | -0.026 | 0.2005 | No | ||
| 18 | FOXA2 | 14405 2889 | 13734 | -0.026 | 0.2092 | No | ||
| 19 | MAFA | 11708 | 14631 | -0.046 | 0.1764 | No | ||
| 20 | HNF4A | 14746 | 14909 | -0.056 | 0.1804 | No | ||
| 21 | SLC2A2 | 15623 1880 1855 | 14916 | -0.056 | 0.1990 | No |