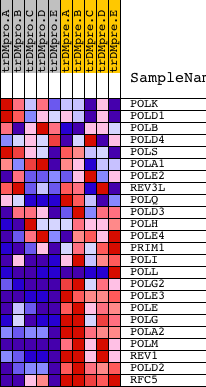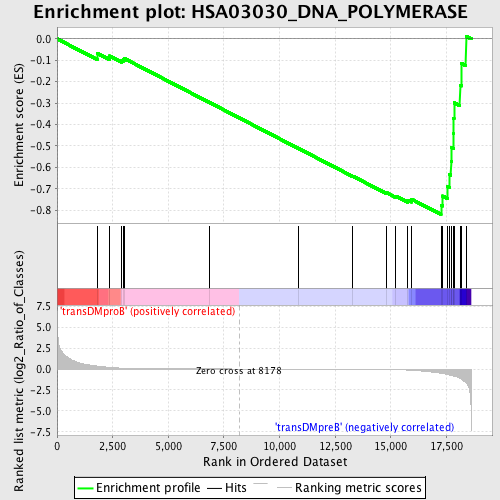
Profile of the Running ES Score & Positions of GeneSet Members on the Rank Ordered List
| Dataset | Set_04_transDMproB_versus_transDMpreB.phenotype_transDMproB_versus_transDMpreB.cls #transDMproB_versus_transDMpreB.phenotype_transDMproB_versus_transDMpreB.cls #transDMproB_versus_transDMpreB_repos |
| Phenotype | phenotype_transDMproB_versus_transDMpreB.cls#transDMproB_versus_transDMpreB_repos |
| Upregulated in class | transDMpreB |
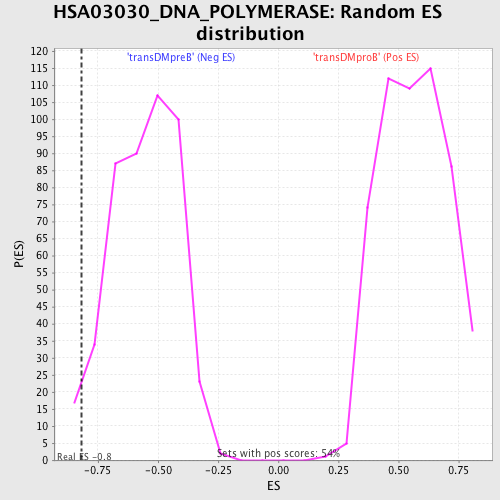
| GeneSet | HSA03030_DNA_POLYMERASE |
| Enrichment Score (ES) | -0.82014096 |
| Normalized Enrichment Score (NES) | -1.4833184 |
| Nominal p-value | 0.019565217 |
| FDR q-value | 0.38732776 |
| FWER p-Value | 0.948 |
| PROBE | DESCRIPTION (from dataset) | GENE SYMBOL | GENE_TITLE | RANK IN GENE LIST | RANK METRIC SCORE | RUNNING ES | CORE ENRICHMENT | |
|---|---|---|---|---|---|---|---|---|
| 1 | POLK | 21384 | 1802 | 0.344 | -0.0673 | No | ||
| 2 | POLD1 | 17847 | 2346 | 0.193 | -0.0799 | No | ||
| 3 | POLB | 9599 | 2898 | 0.101 | -0.1009 | No | ||
| 4 | POLD4 | 12822 | 2969 | 0.094 | -0.0966 | No | ||
| 5 | POLS | 9963 | 3022 | 0.088 | -0.0918 | No | ||
| 6 | POLA1 | 24112 | 6837 | 0.004 | -0.2966 | No | ||
| 7 | POLE2 | 21053 | 10834 | -0.007 | -0.5110 | No | ||
| 8 | REV3L | 20050 | 13283 | -0.020 | -0.6409 | No | ||
| 9 | POLQ | 13407 22768 | 14802 | -0.052 | -0.7181 | No | ||
| 10 | POLD3 | 17742 | 15222 | -0.074 | -0.7342 | No | ||
| 11 | POLH | 22966 | 15764 | -0.124 | -0.7527 | No | ||
| 12 | POLE4 | 12441 | 15939 | -0.148 | -0.7493 | No | ||
| 13 | PRIM1 | 19847 | 17257 | -0.508 | -0.7764 | Yes | ||
| 14 | POLI | 23410 | 17337 | -0.544 | -0.7338 | Yes | ||
| 15 | POLL | 23658 3688 | 17537 | -0.649 | -0.6886 | Yes | ||
| 16 | POLG2 | 20180 | 17642 | -0.709 | -0.6331 | Yes | ||
| 17 | POLE3 | 7200 | 17704 | -0.743 | -0.5724 | Yes | ||
| 18 | POLE | 16755 | 17734 | -0.763 | -0.5083 | Yes | ||
| 19 | POLG | 17789 | 17816 | -0.826 | -0.4415 | Yes | ||
| 20 | POLA2 | 23988 | 17824 | -0.833 | -0.3702 | Yes | ||
| 21 | POLM | 20538 | 17843 | -0.850 | -0.2979 | Yes | ||
| 22 | REV1 | 13971 | 18109 | -1.114 | -0.2163 | Yes | ||
| 23 | POLD2 | 20537 | 18183 | -1.216 | -0.1155 | Yes | ||
| 24 | RFC5 | 13005 7791 | 18379 | -1.611 | 0.0127 | Yes |