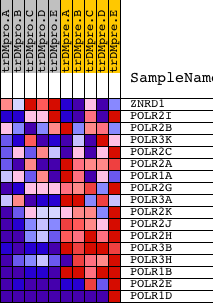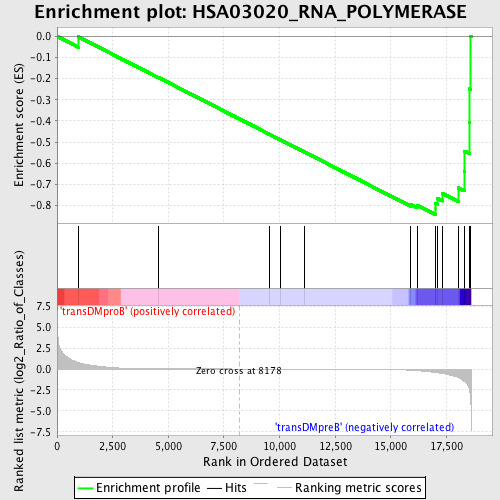
Profile of the Running ES Score & Positions of GeneSet Members on the Rank Ordered List
| Dataset | Set_04_transDMproB_versus_transDMpreB.phenotype_transDMproB_versus_transDMpreB.cls #transDMproB_versus_transDMpreB.phenotype_transDMproB_versus_transDMpreB.cls #transDMproB_versus_transDMpreB_repos |
| Phenotype | phenotype_transDMproB_versus_transDMpreB.cls#transDMproB_versus_transDMpreB_repos |
| Upregulated in class | transDMpreB |
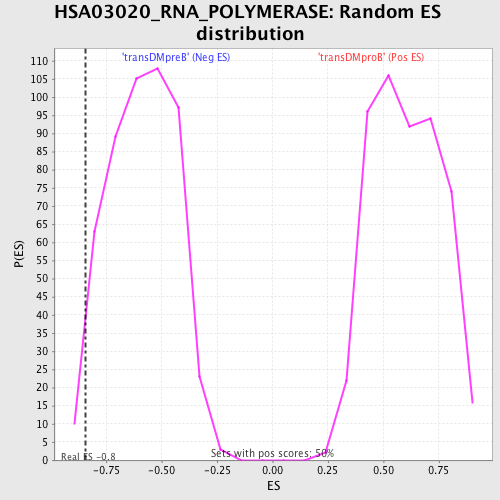
| GeneSet | HSA03020_RNA_POLYMERASE |
| Enrichment Score (ES) | -0.8417661 |
| Normalized Enrichment Score (NES) | -1.4371121 |
| Nominal p-value | 0.030120483 |
| FDR q-value | 0.47007838 |
| FWER p-Value | 1.0 |
| PROBE | DESCRIPTION (from dataset) | GENE SYMBOL | GENE_TITLE | RANK IN GENE LIST | RANK METRIC SCORE | RUNNING ES | CORE ENRICHMENT | |
|---|---|---|---|---|---|---|---|---|
| 1 | ZNRD1 | 1491 22987 | 956 | 0.770 | -0.0023 | No | ||
| 2 | POLR2I | 12839 | 4549 | 0.016 | -0.1944 | No | ||
| 3 | POLR2B | 16817 | 9559 | -0.003 | -0.4635 | No | ||
| 4 | POLR3K | 12447 7372 | 10058 | -0.004 | -0.4900 | No | ||
| 5 | POLR2C | 9750 | 11129 | -0.008 | -0.5470 | No | ||
| 6 | POLR2A | 5394 | 15899 | -0.143 | -0.7943 | No | ||
| 7 | POLR1A | 9749 5393 | 16180 | -0.192 | -0.7971 | No | ||
| 8 | POLR2G | 23753 | 17011 | -0.414 | -0.8154 | Yes | ||
| 9 | POLR3A | 21900 | 17014 | -0.415 | -0.7890 | Yes | ||
| 10 | POLR2K | 9413 | 17083 | -0.439 | -0.7647 | Yes | ||
| 11 | POLR2J | 16672 | 17332 | -0.543 | -0.7434 | Yes | ||
| 12 | POLR2H | 10888 | 18041 | -1.027 | -0.7160 | Yes | ||
| 13 | POLR3B | 12875 | 18305 | -1.460 | -0.6371 | Yes | ||
| 14 | POLR3H | 13460 8135 | 18318 | -1.488 | -0.5428 | Yes | ||
| 15 | POLR1B | 14857 | 18521 | -2.309 | -0.4064 | Yes | ||
| 16 | POLR2E | 3325 19699 | 18536 | -2.490 | -0.2484 | Yes | ||
| 17 | POLR1D | 3593 3658 16623 | 18596 | -3.961 | 0.0011 | Yes |