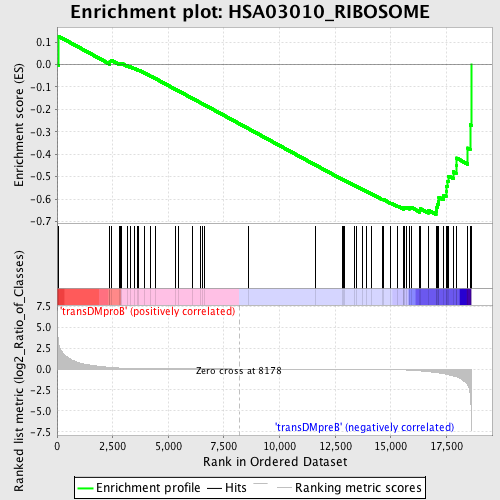
Profile of the Running ES Score & Positions of GeneSet Members on the Rank Ordered List
| Dataset | Set_04_transDMproB_versus_transDMpreB.phenotype_transDMproB_versus_transDMpreB.cls #transDMproB_versus_transDMpreB.phenotype_transDMproB_versus_transDMpreB.cls #transDMproB_versus_transDMpreB_repos |
| Phenotype | phenotype_transDMproB_versus_transDMpreB.cls#transDMproB_versus_transDMpreB_repos |
| Upregulated in class | transDMpreB |
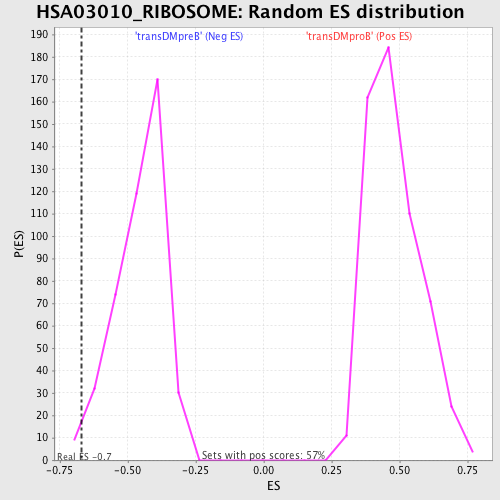
| GeneSet | HSA03010_RIBOSOME |
| Enrichment Score (ES) | -0.6685497 |
| Normalized Enrichment Score (NES) | -1.4693328 |
| Nominal p-value | 0.01843318 |
| FDR q-value | 0.4117096 |
| FWER p-Value | 0.972 |
| PROBE | DESCRIPTION (from dataset) | GENE SYMBOL | GENE_TITLE | RANK IN GENE LIST | RANK METRIC SCORE | RUNNING ES | CORE ENRICHMENT | |
|---|---|---|---|---|---|---|---|---|
| 1 | RPL3L | 23354 | 51 | 3.466 | 0.1267 | No | ||
| 2 | RPS25 | 13270 | 2373 | 0.186 | 0.0086 | No | ||
| 3 | RPL28 | 5392 | 2376 | 0.185 | 0.0154 | No | ||
| 4 | RPL11 | 12450 | 2440 | 0.173 | 0.0185 | No | ||
| 5 | RPS7 | 9760 | 2806 | 0.112 | 0.0030 | No | ||
| 6 | RPS26 | 11331 | 2844 | 0.107 | 0.0050 | No | ||
| 7 | RPL19 | 9736 | 2905 | 0.100 | 0.0055 | No | ||
| 8 | RPS18 | 1529 5397 1603 | 3143 | 0.077 | -0.0044 | No | ||
| 9 | RPS20 | 7438 | 3297 | 0.063 | -0.0103 | No | ||
| 10 | RPL7 | 9748 | 3458 | 0.052 | -0.0169 | No | ||
| 11 | RPS8 | 9761 | 3613 | 0.043 | -0.0236 | No | ||
| 12 | RPL39 | 12496 | 3657 | 0.042 | -0.0244 | No | ||
| 13 | RPS11 | 11317 | 3922 | 0.031 | -0.0374 | No | ||
| 14 | RPL37A | 9744 | 4210 | 0.023 | -0.0520 | No | ||
| 15 | RPL13 | 11284 | 4430 | 0.018 | -0.0631 | No | ||
| 16 | RPS10 | 12464 | 5333 | 0.010 | -0.1114 | No | ||
| 17 | FAU | 8954 | 5444 | 0.009 | -0.1170 | No | ||
| 18 | RPL35 | 12360 | 6071 | 0.006 | -0.1505 | No | ||
| 19 | RPL35A | 12194 | 6445 | 0.005 | -0.1704 | No | ||
| 20 | RPL36A | 9745 | 6536 | 0.004 | -0.1751 | No | ||
| 21 | RPS27 | 12183 | 6613 | 0.004 | -0.1790 | No | ||
| 22 | RPS3 | 6549 11295 | 8616 | -0.001 | -0.2869 | No | ||
| 23 | RPS5 | 18391 | 11625 | -0.009 | -0.4486 | No | ||
| 24 | RPS13 | 12633 | 12823 | -0.016 | -0.5125 | No | ||
| 25 | RPS16 | 9752 | 12850 | -0.016 | -0.5133 | No | ||
| 26 | RPL26 | 9739 | 12927 | -0.017 | -0.5168 | No | ||
| 27 | RPL18 | 450 5390 | 13376 | -0.021 | -0.5401 | No | ||
| 28 | RPS21 | 12356 | 13451 | -0.022 | -0.5433 | No | ||
| 29 | RPL27 | 9740 | 13710 | -0.026 | -0.5563 | No | ||
| 30 | RPSA | 19270 4984 | 13895 | -0.028 | -0.5651 | No | ||
| 31 | RPL13A | 10226 79 | 14116 | -0.033 | -0.5757 | No | ||
| 32 | RPL41 | 12611 | 14629 | -0.046 | -0.6016 | No | ||
| 33 | RPS28 | 12009 | 14674 | -0.047 | -0.6022 | No | ||
| 34 | RPL37 | 12502 7421 22521 | 14998 | -0.061 | -0.6174 | No | ||
| 35 | RPL24 | 12664 | 15317 | -0.080 | -0.6315 | No | ||
| 36 | RPS29 | 9754 | 15581 | -0.102 | -0.6419 | No | ||
| 37 | RPL3 | 11330 | 15584 | -0.102 | -0.6382 | No | ||
| 38 | RPS23 | 12352 | 15635 | -0.110 | -0.6368 | No | ||
| 39 | RPL32 | 9743 | 15697 | -0.115 | -0.6357 | No | ||
| 40 | RPL8 | 22437 | 15856 | -0.136 | -0.6392 | No | ||
| 41 | RPL18A | 13358 | 15931 | -0.146 | -0.6377 | No | ||
| 42 | RPS15A | 6476 | 16310 | -0.220 | -0.6499 | No | ||
| 43 | RPL23A | 11193 | 16315 | -0.221 | -0.6418 | No | ||
| 44 | RPS3A | 9755 | 16692 | -0.318 | -0.6502 | No | ||
| 45 | RPL10A | 9735 | 17033 | -0.423 | -0.6528 | Yes | ||
| 46 | RPL6 | 9747 | 17067 | -0.434 | -0.6383 | Yes | ||
| 47 | RPS6 | 9757 | 17092 | -0.443 | -0.6231 | Yes | ||
| 48 | RPS2 | 9279 | 17144 | -0.459 | -0.6087 | Yes | ||
| 49 | RPL36AL | 12357 | 17159 | -0.463 | -0.5921 | Yes | ||
| 50 | RPL30 | 9742 | 17366 | -0.561 | -0.5823 | Yes | ||
| 51 | RPL31 | 14267 | 17485 | -0.621 | -0.5654 | Yes | ||
| 52 | RPL12 | 11243 | 17495 | -0.628 | -0.5425 | Yes | ||
| 53 | RPS24 | 5399 | 17548 | -0.655 | -0.5208 | Yes | ||
| 54 | MRPS7 | 20595 | 17599 | -0.689 | -0.4978 | Yes | ||
| 55 | RPL14 | 19267 | 17812 | -0.822 | -0.4785 | Yes | ||
| 56 | RPL21 | 9737 16624 5391 | 17936 | -0.918 | -0.4508 | Yes | ||
| 57 | RPL29 | 9741 | 17947 | -0.928 | -0.4167 | Yes | ||
| 58 | RPL27A | 11181 6467 18130 | 18462 | -1.936 | -0.3721 | Yes | ||
| 59 | MRPL13 | 2249 22294 | 18565 | -2.909 | -0.2689 | Yes | ||
| 60 | RPL38 | 12562 20606 7475 | 18616 | -7.271 | -0.0000 | Yes |