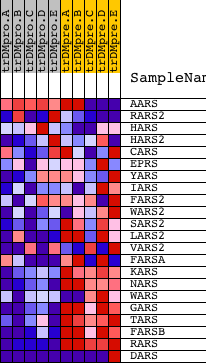
Profile of the Running ES Score & Positions of GeneSet Members on the Rank Ordered List
| Dataset | Set_04_transDMproB_versus_transDMpreB.phenotype_transDMproB_versus_transDMpreB.cls #transDMproB_versus_transDMpreB.phenotype_transDMproB_versus_transDMpreB.cls #transDMproB_versus_transDMpreB_repos |
| Phenotype | phenotype_transDMproB_versus_transDMpreB.cls#transDMproB_versus_transDMpreB_repos |
| Upregulated in class | transDMpreB |
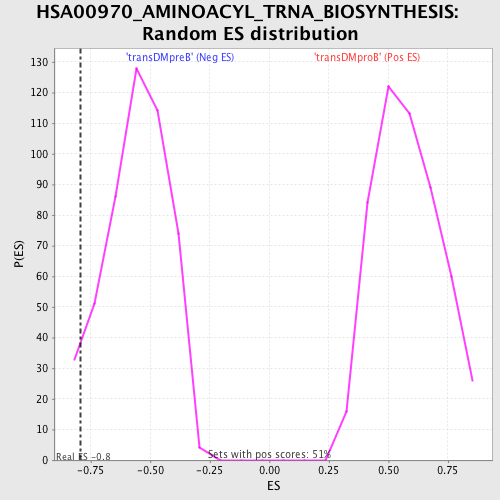
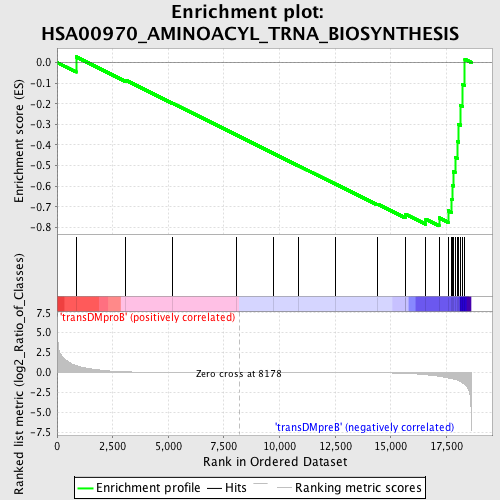
| GeneSet | HSA00970_AMINOACYL_TRNA_BIOSYNTHESIS |
| Enrichment Score (ES) | -0.79310024 |
| Normalized Enrichment Score (NES) | -1.4227027 |
| Nominal p-value | 0.057142857 |
| FDR q-value | 0.40515414 |
| FWER p-Value | 1.0 |
| PROBE | DESCRIPTION (from dataset) | GENE SYMBOL | GENE_TITLE | RANK IN GENE LIST | RANK METRIC SCORE | RUNNING ES | CORE ENRICHMENT | |
|---|---|---|---|---|---|---|---|---|
| 1 | AARS | 10630 6151 | 853 | 0.873 | 0.0277 | No | ||
| 2 | RARS2 | 16247 2490 2411 | 3091 | 0.082 | -0.0857 | No | ||
| 3 | HARS | 23451 | 5177 | 0.011 | -0.1969 | No | ||
| 4 | HARS2 | 23592 14820 | 8044 | 0.000 | -0.3510 | No | ||
| 5 | CARS | 1683 17544 | 9712 | -0.004 | -0.4404 | No | ||
| 6 | EPRS | 14014 | 10842 | -0.007 | -0.5005 | No | ||
| 7 | YARS | 16071 | 12527 | -0.014 | -0.5899 | No | ||
| 8 | IARS | 4190 8361 8362 | 14413 | -0.040 | -0.6879 | No | ||
| 9 | FARS2 | 21666 | 15647 | -0.110 | -0.7449 | No | ||
| 10 | WARS2 | 12884 7688 | 15664 | -0.112 | -0.7363 | No | ||
| 11 | SARS2 | 5 | 16573 | -0.287 | -0.7610 | Yes | ||
| 12 | LARS2 | 19255 | 17171 | -0.465 | -0.7539 | Yes | ||
| 13 | VARS2 | 23265 1595 7588 | 17578 | -0.675 | -0.7188 | Yes | ||
| 14 | FARSA | 7311 | 17735 | -0.763 | -0.6629 | Yes | ||
| 15 | KARS | 18738 | 17777 | -0.800 | -0.5977 | Yes | ||
| 16 | NARS | 23418 | 17807 | -0.821 | -0.5301 | Yes | ||
| 17 | WARS | 2085 20984 | 17890 | -0.885 | -0.4599 | Yes | ||
| 18 | GARS | 17438 | 17998 | -0.972 | -0.3837 | Yes | ||
| 19 | TARS | 22325 8502 | 18046 | -1.030 | -0.2994 | Yes | ||
| 20 | FARSB | 13909 | 18127 | -1.136 | -0.2079 | Yes | ||
| 21 | RARS | 20496 | 18210 | -1.272 | -0.1052 | Yes | ||
| 22 | DARS | 10375 13846 | 18330 | -1.506 | 0.0154 | Yes |