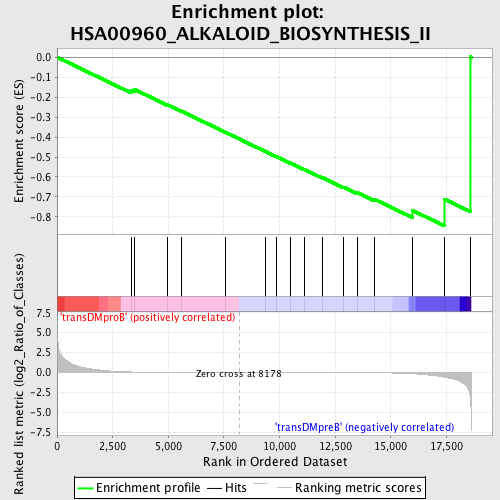
Profile of the Running ES Score & Positions of GeneSet Members on the Rank Ordered List
| Dataset | Set_04_transDMproB_versus_transDMpreB.phenotype_transDMproB_versus_transDMpreB.cls #transDMproB_versus_transDMpreB.phenotype_transDMproB_versus_transDMpreB.cls #transDMproB_versus_transDMpreB_repos |
| Phenotype | phenotype_transDMproB_versus_transDMpreB.cls#transDMproB_versus_transDMpreB_repos |
| Upregulated in class | transDMpreB |
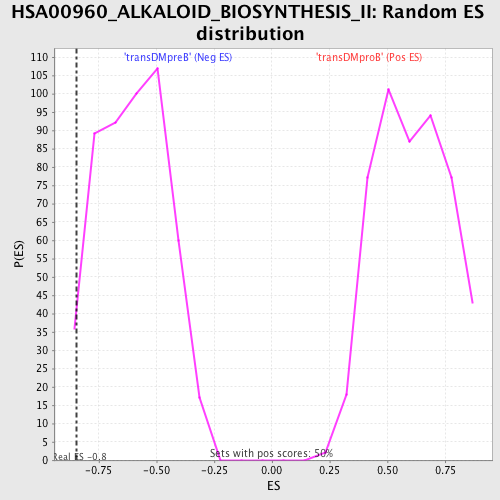
| GeneSet | HSA00960_ALKALOID_BIOSYNTHESIS_II |
| Enrichment Score (ES) | -0.8452807 |
| Normalized Enrichment Score (NES) | -1.4072043 |
| Nominal p-value | 0.025948104 |
| FDR q-value | 0.45884192 |
| FWER p-Value | 1.0 |
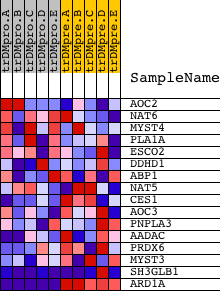
| PROBE | DESCRIPTION (from dataset) | GENE SYMBOL | GENE_TITLE | RANK IN GENE LIST | RANK METRIC SCORE | RUNNING ES | CORE ENRICHMENT | |
|---|---|---|---|---|---|---|---|---|
| 1 | AOC2 | 20658 1256 | 3331 | 0.061 | -0.1651 | No | ||
| 2 | NAT6 | 12131 | 3489 | 0.050 | -0.1621 | No | ||
| 3 | MYST4 | 7027 7026 12014 2739 | 4971 | 0.012 | -0.2390 | No | ||
| 4 | PLA1A | 1737 22594 | 5573 | 0.008 | -0.2694 | No | ||
| 5 | ESCO2 | 21781 | 7557 | 0.002 | -0.3756 | No | ||
| 6 | DDHD1 | 497 496 4339 | 9365 | -0.003 | -0.4721 | No | ||
| 7 | ABP1 | 17455 4598 | 9843 | -0.004 | -0.4969 | No | ||
| 8 | NAT5 | 18601 7496 12597 | 10468 | -0.006 | -0.5292 | No | ||
| 9 | CES1 | 18789 | 11120 | -0.008 | -0.5625 | No | ||
| 10 | AOC3 | 8595 | 11934 | -0.011 | -0.6037 | No | ||
| 11 | PNPLA3 | 22406 | 12878 | -0.017 | -0.6506 | No | ||
| 12 | AADAC | 15584 | 13516 | -0.023 | -0.6796 | No | ||
| 13 | PRDX6 | 4389 8596 | 14250 | -0.036 | -0.7109 | No | ||
| 14 | MYST3 | 18651 | 15979 | -0.156 | -0.7679 | Yes | ||
| 15 | SH3GLB1 | 12057 7051 | 17419 | -0.584 | -0.7114 | Yes | ||
| 16 | ARD1A | 2555 7089 12092 | 18584 | -3.387 | 0.0017 | Yes |