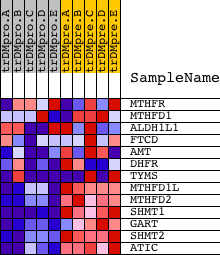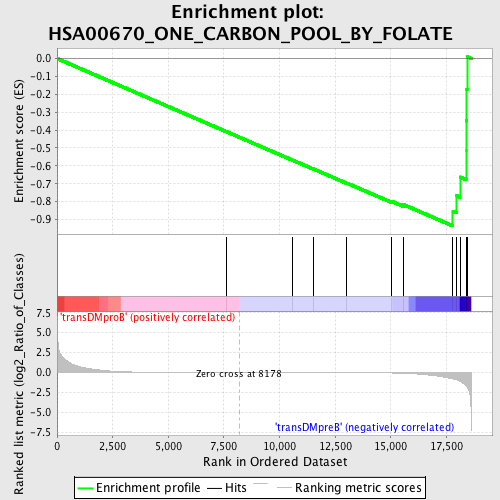
Profile of the Running ES Score & Positions of GeneSet Members on the Rank Ordered List
| Dataset | Set_04_transDMproB_versus_transDMpreB.phenotype_transDMproB_versus_transDMpreB.cls #transDMproB_versus_transDMpreB.phenotype_transDMproB_versus_transDMpreB.cls #transDMproB_versus_transDMpreB_repos |
| Phenotype | phenotype_transDMproB_versus_transDMpreB.cls#transDMproB_versus_transDMpreB_repos |
| Upregulated in class | transDMpreB |
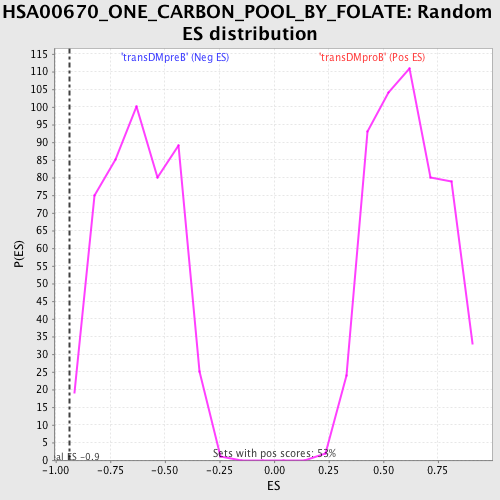
| GeneSet | HSA00670_ONE_CARBON_POOL_BY_FOLATE |
| Enrichment Score (ES) | -0.9361631 |
| Normalized Enrichment Score (NES) | -1.5137799 |
| Nominal p-value | 0.0021097045 |
| FDR q-value | 0.47091362 |
| FWER p-Value | 0.835 |
| PROBE | DESCRIPTION (from dataset) | GENE SYMBOL | GENE_TITLE | RANK IN GENE LIST | RANK METRIC SCORE | RUNNING ES | CORE ENRICHMENT | |
|---|---|---|---|---|---|---|---|---|
| 1 | MTHFR | 5130 | 7612 | 0.002 | -0.4090 | No | ||
| 2 | MTHFD1 | 2132 21238 | 10571 | -0.006 | -0.5674 | No | ||
| 3 | ALDH1L1 | 17358 1014 | 11509 | -0.009 | -0.6169 | No | ||
| 4 | FTCD | 3390 19979 | 13018 | -0.018 | -0.6961 | No | ||
| 5 | AMT | 322 | 15018 | -0.062 | -0.7973 | No | ||
| 6 | DHFR | 21590 | 15562 | -0.101 | -0.8163 | No | ||
| 7 | TYMS | 5810 5809 3606 3598 | 17793 | -0.813 | -0.8537 | Yes | ||
| 8 | MTHFD1L | 11300 | 17965 | -0.937 | -0.7678 | Yes | ||
| 9 | MTHFD2 | 17100 | 18110 | -1.117 | -0.6623 | Yes | ||
| 10 | SHMT1 | 5431 | 18386 | -1.614 | -0.5134 | Yes | ||
| 11 | GART | 22543 1754 | 18389 | -1.632 | -0.3480 | Yes | ||
| 12 | SHMT2 | 3307 19601 | 18414 | -1.725 | -0.1743 | Yes | ||
| 13 | ATIC | 14231 3968 | 18440 | -1.825 | 0.0095 | Yes |