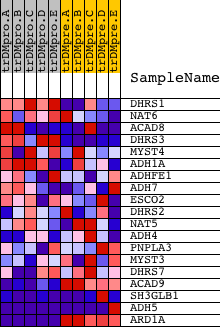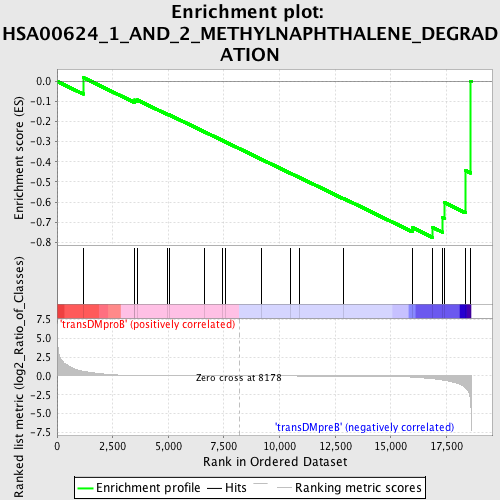
Profile of the Running ES Score & Positions of GeneSet Members on the Rank Ordered List
| Dataset | Set_04_transDMproB_versus_transDMpreB.phenotype_transDMproB_versus_transDMpreB.cls #transDMproB_versus_transDMpreB.phenotype_transDMproB_versus_transDMpreB.cls #transDMproB_versus_transDMpreB_repos |
| Phenotype | phenotype_transDMproB_versus_transDMpreB.cls#transDMproB_versus_transDMpreB_repos |
| Upregulated in class | transDMpreB |
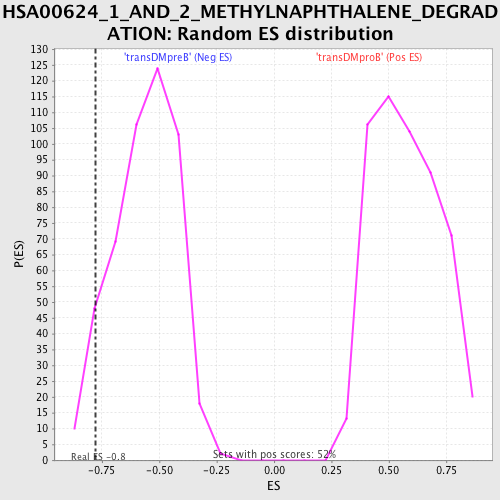
| GeneSet | HSA00624_1_AND_2_METHYLNAPHTHALENE_DEGRADATION |
| Enrichment Score (ES) | -0.7759627 |
| Normalized Enrichment Score (NES) | -1.3835468 |
| Nominal p-value | 0.06666667 |
| FDR q-value | 0.5290714 |
| FWER p-Value | 1.0 |
| PROBE | DESCRIPTION (from dataset) | GENE SYMBOL | GENE_TITLE | RANK IN GENE LIST | RANK METRIC SCORE | RUNNING ES | CORE ENRICHMENT | |
|---|---|---|---|---|---|---|---|---|
| 1 | DHRS1 | 21819 | 1173 | 0.606 | 0.0187 | No | ||
| 2 | NAT6 | 12131 | 3489 | 0.050 | -0.0990 | No | ||
| 3 | ACAD8 | 19192 3134 3032 | 3496 | 0.050 | -0.0926 | No | ||
| 4 | DHRS3 | 15997 | 3601 | 0.044 | -0.0922 | No | ||
| 5 | MYST4 | 7027 7026 12014 2739 | 4971 | 0.012 | -0.1642 | No | ||
| 6 | ADH1A | 15406 | 5030 | 0.011 | -0.1658 | No | ||
| 7 | ADHFE1 | 4049 8008 | 6635 | 0.004 | -0.2515 | No | ||
| 8 | ADH7 | 15408 | 7434 | 0.002 | -0.2941 | No | ||
| 9 | ESCO2 | 21781 | 7557 | 0.002 | -0.3005 | No | ||
| 10 | DHRS2 | 22011 | 9190 | -0.002 | -0.3879 | No | ||
| 11 | NAT5 | 18601 7496 12597 | 10468 | -0.006 | -0.4558 | No | ||
| 12 | ADH4 | 15405 | 10913 | -0.007 | -0.4788 | No | ||
| 13 | PNPLA3 | 22406 | 12878 | -0.017 | -0.5821 | No | ||
| 14 | MYST3 | 18651 | 15979 | -0.156 | -0.7277 | Yes | ||
| 15 | DHRS7 | 2135 12338 | 16878 | -0.369 | -0.7261 | Yes | ||
| 16 | ACAD9 | 10470 6020 | 17321 | -0.539 | -0.6770 | Yes | ||
| 17 | SH3GLB1 | 12057 7051 | 17419 | -0.584 | -0.6032 | Yes | ||
| 18 | ADH5 | 8554 15404 | 18355 | -1.554 | -0.4435 | Yes | ||
| 19 | ARD1A | 2555 7089 12092 | 18584 | -3.387 | 0.0017 | Yes |