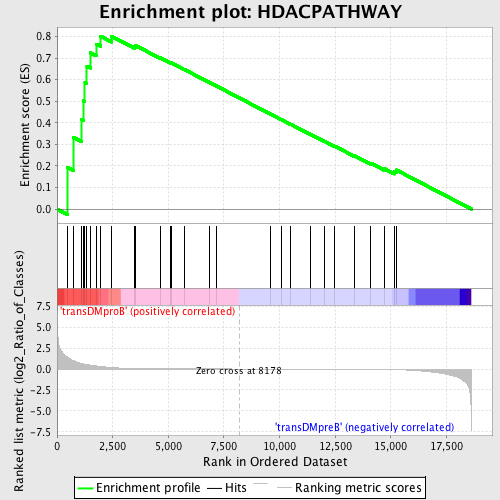
Profile of the Running ES Score & Positions of GeneSet Members on the Rank Ordered List
| Dataset | Set_04_transDMproB_versus_transDMpreB.phenotype_transDMproB_versus_transDMpreB.cls #transDMproB_versus_transDMpreB.phenotype_transDMproB_versus_transDMpreB.cls #transDMproB_versus_transDMpreB_repos |
| Phenotype | phenotype_transDMproB_versus_transDMpreB.cls#transDMproB_versus_transDMpreB_repos |
| Upregulated in class | transDMproB |
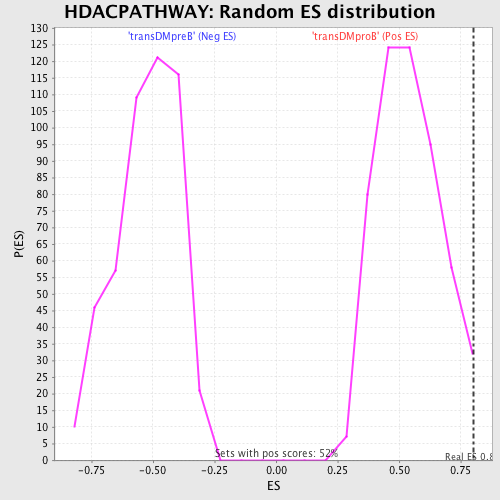
| GeneSet | HDACPATHWAY |
| Enrichment Score (ES) | 0.8014271 |
| Normalized Enrichment Score (NES) | 1.477474 |
| Nominal p-value | 0.023076924 |
| FDR q-value | 0.26647735 |
| FWER p-Value | 0.965 |
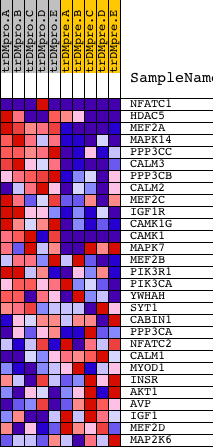
| PROBE | DESCRIPTION (from dataset) | GENE SYMBOL | GENE_TITLE | RANK IN GENE LIST | RANK METRIC SCORE | RUNNING ES | CORE ENRICHMENT | |
|---|---|---|---|---|---|---|---|---|
| 1 | NFATC1 | 23398 1999 5167 9455 1985 1957 | 464 | 1.425 | 0.1941 | Yes | ||
| 2 | HDAC5 | 1480 20205 | 723 | 0.996 | 0.3332 | Yes | ||
| 3 | MEF2A | 1201 5089 3492 | 1095 | 0.656 | 0.4141 | Yes | ||
| 4 | MAPK14 | 23313 | 1184 | 0.600 | 0.5016 | Yes | ||
| 5 | PPP3CC | 21763 | 1251 | 0.569 | 0.5855 | Yes | ||
| 6 | CALM3 | 8682 | 1340 | 0.528 | 0.6620 | Yes | ||
| 7 | PPP3CB | 5285 | 1499 | 0.461 | 0.7244 | Yes | ||
| 8 | CALM2 | 8681 | 1771 | 0.355 | 0.7644 | Yes | ||
| 9 | MEF2C | 3204 9378 | 1945 | 0.302 | 0.8014 | Yes | ||
| 10 | IGF1R | 9157 | 2456 | 0.170 | 0.8001 | No | ||
| 11 | CAMK1G | 13710 4129 | 3483 | 0.051 | 0.7527 | No | ||
| 12 | CAMK1 | 1037 1170 17044 | 3520 | 0.048 | 0.7582 | No | ||
| 13 | MAPK7 | 1381 20414 | 4636 | 0.015 | 0.7005 | No | ||
| 14 | MEF2B | 9377 | 5115 | 0.011 | 0.6765 | No | ||
| 15 | PIK3R1 | 3170 | 5127 | 0.011 | 0.6775 | No | ||
| 16 | PIK3CA | 9562 | 5742 | 0.007 | 0.6456 | No | ||
| 17 | YWHAH | 5937 10368 | 6860 | 0.003 | 0.5861 | No | ||
| 18 | SYT1 | 5565 | 7163 | 0.003 | 0.5702 | No | ||
| 19 | CABIN1 | 19733 | 9583 | -0.003 | 0.4406 | No | ||
| 20 | PPP3CA | 1863 5284 | 10074 | -0.004 | 0.4149 | No | ||
| 21 | NFATC2 | 5168 2866 | 10494 | -0.006 | 0.3932 | No | ||
| 22 | CALM1 | 21184 | 11378 | -0.008 | 0.3470 | No | ||
| 23 | MYOD1 | 18237 | 12029 | -0.011 | 0.3138 | No | ||
| 24 | INSR | 18950 | 12468 | -0.014 | 0.2923 | No | ||
| 25 | AKT1 | 8568 | 13355 | -0.021 | 0.2478 | No | ||
| 26 | AVP | 14428 | 14106 | -0.032 | 0.2125 | No | ||
| 27 | IGF1 | 3352 9156 3409 | 14702 | -0.048 | 0.1878 | No | ||
| 28 | MEF2D | 9379 | 15172 | -0.071 | 0.1735 | No | ||
| 29 | MAP2K6 | 20614 1414 | 15246 | -0.076 | 0.1813 | No |