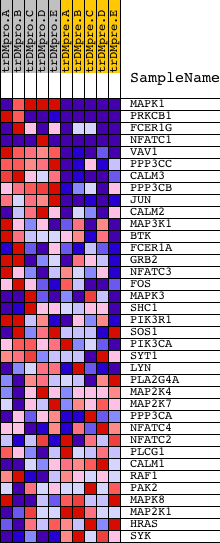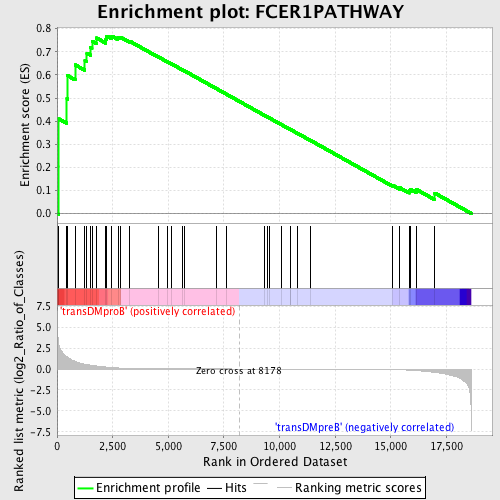
Profile of the Running ES Score & Positions of GeneSet Members on the Rank Ordered List
| Dataset | Set_04_transDMproB_versus_transDMpreB.phenotype_transDMproB_versus_transDMpreB.cls #transDMproB_versus_transDMpreB.phenotype_transDMproB_versus_transDMpreB.cls #transDMproB_versus_transDMpreB_repos |
| Phenotype | phenotype_transDMproB_versus_transDMpreB.cls#transDMproB_versus_transDMpreB_repos |
| Upregulated in class | transDMproB |
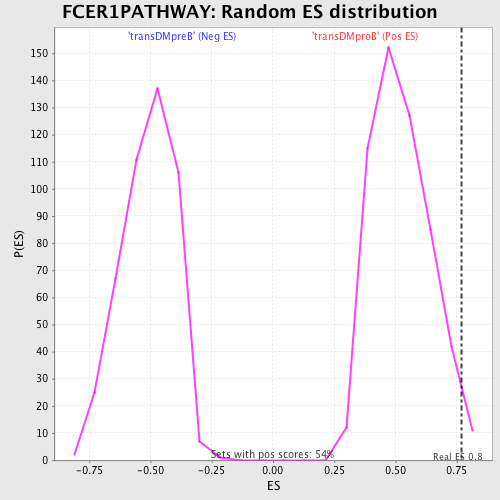
| GeneSet | FCER1PATHWAY |
| Enrichment Score (ES) | 0.7679344 |
| Normalized Enrichment Score (NES) | 1.4723358 |
| Nominal p-value | 0.020220589 |
| FDR q-value | 0.27423567 |
| FWER p-Value | 0.973 |
| PROBE | DESCRIPTION (from dataset) | GENE SYMBOL | GENE_TITLE | RANK IN GENE LIST | RANK METRIC SCORE | RUNNING ES | CORE ENRICHMENT | |
|---|---|---|---|---|---|---|---|---|
| 1 | MAPK1 | 1642 11167 | 80 | 2.911 | 0.2044 | Yes | ||
| 2 | PRKCB1 | 1693 9574 | 81 | 2.858 | 0.4094 | Yes | ||
| 3 | FCER1G | 13759 | 442 | 1.480 | 0.4962 | Yes | ||
| 4 | NFATC1 | 23398 1999 5167 9455 1985 1957 | 464 | 1.425 | 0.5972 | Yes | ||
| 5 | VAV1 | 23173 | 813 | 0.905 | 0.6434 | Yes | ||
| 6 | PPP3CC | 21763 | 1251 | 0.569 | 0.6606 | Yes | ||
| 7 | CALM3 | 8682 | 1340 | 0.528 | 0.6938 | Yes | ||
| 8 | PPP3CB | 5285 | 1499 | 0.461 | 0.7184 | Yes | ||
| 9 | JUN | 15832 | 1569 | 0.428 | 0.7453 | Yes | ||
| 10 | CALM2 | 8681 | 1771 | 0.355 | 0.7600 | Yes | ||
| 11 | MAP3K1 | 21348 | 2190 | 0.232 | 0.7541 | Yes | ||
| 12 | BTK | 24061 | 2229 | 0.221 | 0.7679 | Yes | ||
| 13 | FCER1A | 8957 | 2458 | 0.169 | 0.7678 | No | ||
| 14 | GRB2 | 20149 | 2736 | 0.123 | 0.7618 | No | ||
| 15 | NFATC3 | 5169 | 2840 | 0.108 | 0.7639 | No | ||
| 16 | FOS | 21202 | 3267 | 0.066 | 0.7457 | No | ||
| 17 | MAPK3 | 6458 11170 | 4552 | 0.016 | 0.6778 | No | ||
| 18 | SHC1 | 9813 9812 5430 | 4950 | 0.012 | 0.6573 | No | ||
| 19 | PIK3R1 | 3170 | 5127 | 0.011 | 0.6486 | No | ||
| 20 | SOS1 | 5476 | 5657 | 0.008 | 0.6207 | No | ||
| 21 | PIK3CA | 9562 | 5742 | 0.007 | 0.6167 | No | ||
| 22 | SYT1 | 5565 | 7163 | 0.003 | 0.5404 | No | ||
| 23 | LYN | 16281 | 7607 | 0.002 | 0.5167 | No | ||
| 24 | PLA2G4A | 13809 | 9332 | -0.003 | 0.4241 | No | ||
| 25 | MAP2K4 | 20405 | 9477 | -0.003 | 0.4166 | No | ||
| 26 | MAP2K7 | 6453 | 9567 | -0.003 | 0.4120 | No | ||
| 27 | PPP3CA | 1863 5284 | 10074 | -0.004 | 0.3851 | No | ||
| 28 | NFATC4 | 22002 | 10475 | -0.006 | 0.3640 | No | ||
| 29 | NFATC2 | 5168 2866 | 10494 | -0.006 | 0.3634 | No | ||
| 30 | PLCG1 | 14753 | 10822 | -0.007 | 0.3463 | No | ||
| 31 | CALM1 | 21184 | 11378 | -0.008 | 0.3170 | No | ||
| 32 | RAF1 | 17035 | 15064 | -0.065 | 0.1233 | No | ||
| 33 | PAK2 | 10310 5875 | 15410 | -0.087 | 0.1110 | No | ||
| 34 | MAPK8 | 6459 | 15826 | -0.132 | 0.0981 | No | ||
| 35 | MAP2K1 | 19082 | 15878 | -0.140 | 0.1054 | No | ||
| 36 | HRAS | 4868 | 16140 | -0.184 | 0.1045 | No | ||
| 37 | SYK | 21636 | 16978 | -0.400 | 0.0882 | No |