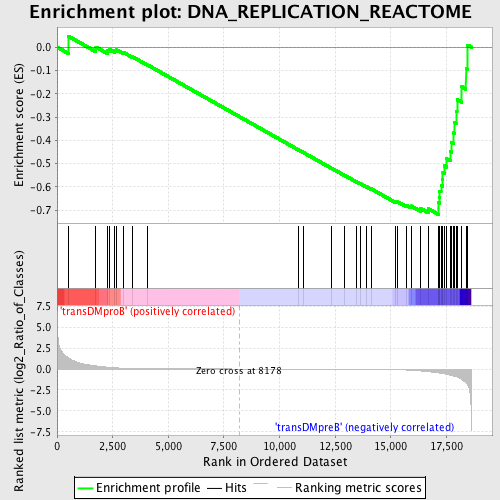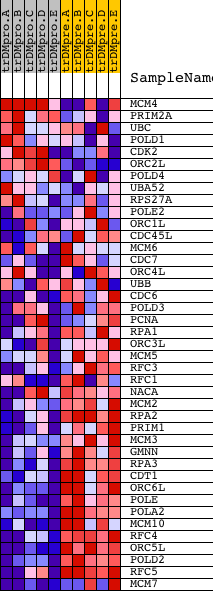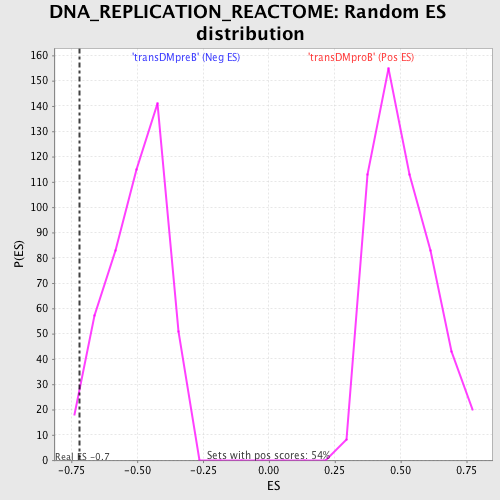
Profile of the Running ES Score & Positions of GeneSet Members on the Rank Ordered List
| Dataset | Set_04_transDMproB_versus_transDMpreB.phenotype_transDMproB_versus_transDMpreB.cls #transDMproB_versus_transDMpreB.phenotype_transDMproB_versus_transDMpreB.cls #transDMproB_versus_transDMpreB_repos |
| Phenotype | phenotype_transDMproB_versus_transDMpreB.cls#transDMproB_versus_transDMpreB_repos |
| Upregulated in class | transDMpreB |
| GeneSet | DNA_REPLICATION_REACTOME |
| Enrichment Score (ES) | -0.71861535 |
| Normalized Enrichment Score (NES) | -1.4237927 |
| Nominal p-value | 0.023655914 |
| FDR q-value | 0.43111855 |
| FWER p-Value | 1.0 |

| PROBE | DESCRIPTION (from dataset) | GENE SYMBOL | GENE_TITLE | RANK IN GENE LIST | RANK METRIC SCORE | RUNNING ES | CORE ENRICHMENT | |
|---|---|---|---|---|---|---|---|---|
| 1 | MCM4 | 22655 1708 | 497 | 1.345 | 0.0474 | No | ||
| 2 | PRIM2A | 13986 | 1744 | 0.364 | 0.0003 | No | ||
| 3 | UBC | 14 14 10241 15 16 | 2255 | 0.216 | -0.0152 | No | ||
| 4 | POLD1 | 17847 | 2346 | 0.193 | -0.0094 | No | ||
| 5 | CDK2 | 3438 3373 19592 3322 | 2570 | 0.150 | -0.0132 | No | ||
| 6 | ORC2L | 385 13949 | 2681 | 0.133 | -0.0118 | No | ||
| 7 | POLD4 | 12822 | 2969 | 0.094 | -0.0220 | No | ||
| 8 | UBA52 | 10239 | 3391 | 0.056 | -0.0416 | No | ||
| 9 | RPS27A | 13433 | 4081 | 0.027 | -0.0772 | No | ||
| 10 | POLE2 | 21053 | 10834 | -0.007 | -0.4403 | No | ||
| 11 | ORC1L | 327 16144 | 11070 | -0.007 | -0.4526 | No | ||
| 12 | CDC45L | 22642 1752 | 12341 | -0.013 | -0.5202 | No | ||
| 13 | MCM6 | 4000 13845 4119 | 12906 | -0.017 | -0.5497 | No | ||
| 14 | CDC7 | 16765 3477 | 13471 | -0.022 | -0.5788 | No | ||
| 15 | ORC4L | 11172 6460 | 13622 | -0.024 | -0.5855 | No | ||
| 16 | UBB | 10240 | 13920 | -0.029 | -0.5999 | No | ||
| 17 | CDC6 | 6221 6220 | 14118 | -0.033 | -0.6087 | No | ||
| 18 | POLD3 | 17742 | 15222 | -0.074 | -0.6640 | No | ||
| 19 | PCNA | 9535 | 15286 | -0.078 | -0.6631 | No | ||
| 20 | RPA1 | 20349 | 15720 | -0.118 | -0.6799 | No | ||
| 21 | ORC3L | 6941 | 15908 | -0.144 | -0.6820 | No | ||
| 22 | MCM5 | 18564 | 16331 | -0.224 | -0.6924 | No | ||
| 23 | RFC3 | 12786 | 16696 | -0.318 | -0.6944 | Yes | ||
| 24 | RFC1 | 16527 | 17146 | -0.459 | -0.6933 | Yes | ||
| 25 | NACA | 9444 5147 | 17147 | -0.459 | -0.6680 | Yes | ||
| 26 | MCM2 | 17074 | 17185 | -0.472 | -0.6439 | Yes | ||
| 27 | RPA2 | 2330 16057 | 17200 | -0.478 | -0.6183 | Yes | ||
| 28 | PRIM1 | 19847 | 17257 | -0.508 | -0.5933 | Yes | ||
| 29 | MCM3 | 13991 | 17329 | -0.542 | -0.5673 | Yes | ||
| 30 | GMNN | 21513 | 17342 | -0.547 | -0.5378 | Yes | ||
| 31 | RPA3 | 12667 | 17407 | -0.581 | -0.5092 | Yes | ||
| 32 | CDT1 | 18437 | 17516 | -0.639 | -0.4798 | Yes | ||
| 33 | ORC6L | 18539 | 17669 | -0.723 | -0.4481 | Yes | ||
| 34 | POLE | 16755 | 17734 | -0.763 | -0.4095 | Yes | ||
| 35 | POLA2 | 23988 | 17824 | -0.833 | -0.3684 | Yes | ||
| 36 | MCM10 | 14694 | 17861 | -0.863 | -0.3227 | Yes | ||
| 37 | RFC4 | 1735 22627 | 17938 | -0.919 | -0.2761 | Yes | ||
| 38 | ORC5L | 11173 3595 | 17976 | -0.948 | -0.2258 | Yes | ||
| 39 | POLD2 | 20537 | 18183 | -1.216 | -0.1699 | Yes | ||
| 40 | RFC5 | 13005 7791 | 18379 | -1.611 | -0.0916 | Yes | ||
| 41 | MCM7 | 9372 3568 | 18458 | -1.891 | 0.0085 | Yes |

