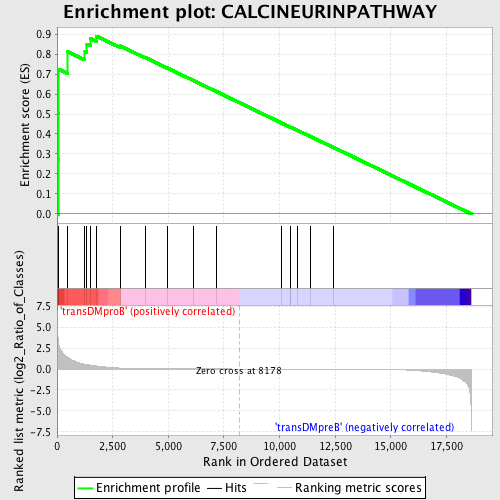
Profile of the Running ES Score & Positions of GeneSet Members on the Rank Ordered List
| Dataset | Set_04_transDMproB_versus_transDMpreB.phenotype_transDMproB_versus_transDMpreB.cls #transDMproB_versus_transDMpreB.phenotype_transDMproB_versus_transDMpreB.cls #transDMproB_versus_transDMpreB_repos |
| Phenotype | phenotype_transDMproB_versus_transDMpreB.cls#transDMproB_versus_transDMpreB_repos |
| Upregulated in class | transDMproB |
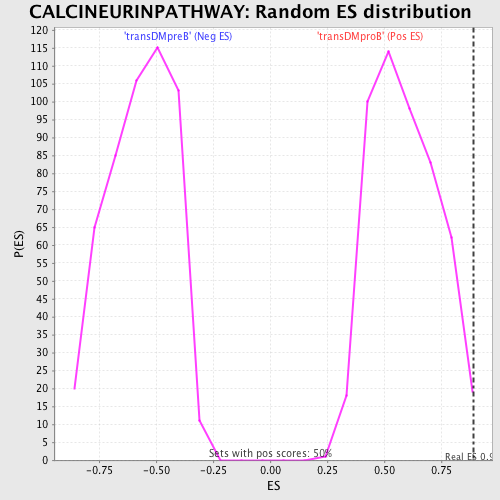
| GeneSet | CALCINEURINPATHWAY |
| Enrichment Score (ES) | 0.88960904 |
| Normalized Enrichment Score (NES) | 1.5063475 |
| Nominal p-value | 0.006060606 |
| FDR q-value | 0.20940897 |
| FWER p-Value | 0.854 |
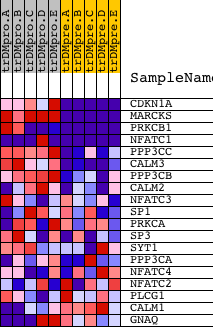
| PROBE | DESCRIPTION (from dataset) | GENE SYMBOL | GENE_TITLE | RANK IN GENE LIST | RANK METRIC SCORE | RUNNING ES | CORE ENRICHMENT | |
|---|---|---|---|---|---|---|---|---|
| 1 | CDKN1A | 4511 8729 | 49 | 3.556 | 0.2706 | Yes | ||
| 2 | MARCKS | 9331 | 69 | 3.057 | 0.5045 | Yes | ||
| 3 | PRKCB1 | 1693 9574 | 81 | 2.858 | 0.7236 | Yes | ||
| 4 | NFATC1 | 23398 1999 5167 9455 1985 1957 | 464 | 1.425 | 0.8126 | Yes | ||
| 5 | PPP3CC | 21763 | 1251 | 0.569 | 0.8141 | Yes | ||
| 6 | CALM3 | 8682 | 1340 | 0.528 | 0.8499 | Yes | ||
| 7 | PPP3CB | 5285 | 1499 | 0.461 | 0.8769 | Yes | ||
| 8 | CALM2 | 8681 | 1771 | 0.355 | 0.8896 | Yes | ||
| 9 | NFATC3 | 5169 | 2840 | 0.108 | 0.8405 | No | ||
| 10 | SP1 | 9852 | 3958 | 0.030 | 0.7827 | No | ||
| 11 | PRKCA | 20174 | 4949 | 0.012 | 0.7304 | No | ||
| 12 | SP3 | 5483 | 6119 | 0.006 | 0.6680 | No | ||
| 13 | SYT1 | 5565 | 7163 | 0.003 | 0.6121 | No | ||
| 14 | PPP3CA | 1863 5284 | 10074 | -0.004 | 0.4560 | No | ||
| 15 | NFATC4 | 22002 | 10475 | -0.006 | 0.4349 | No | ||
| 16 | NFATC2 | 5168 2866 | 10494 | -0.006 | 0.4344 | No | ||
| 17 | PLCG1 | 14753 | 10822 | -0.007 | 0.4173 | No | ||
| 18 | CALM1 | 21184 | 11378 | -0.008 | 0.3881 | No | ||
| 19 | GNAQ | 4786 23909 3685 | 12410 | -0.013 | 0.3337 | No |