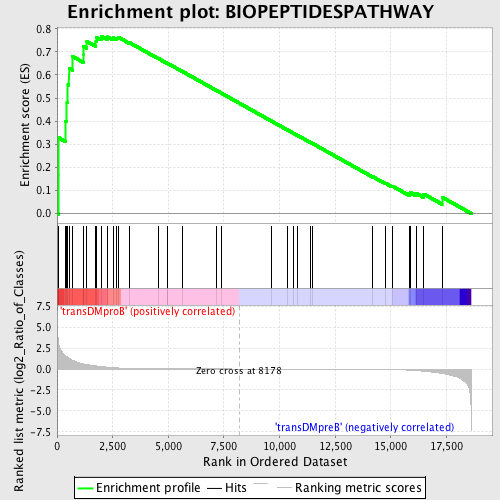
Profile of the Running ES Score & Positions of GeneSet Members on the Rank Ordered List
| Dataset | Set_04_transDMproB_versus_transDMpreB.phenotype_transDMproB_versus_transDMpreB.cls #transDMproB_versus_transDMpreB.phenotype_transDMproB_versus_transDMpreB.cls #transDMproB_versus_transDMpreB_repos |
| Phenotype | phenotype_transDMproB_versus_transDMpreB.cls#transDMproB_versus_transDMpreB_repos |
| Upregulated in class | transDMproB |
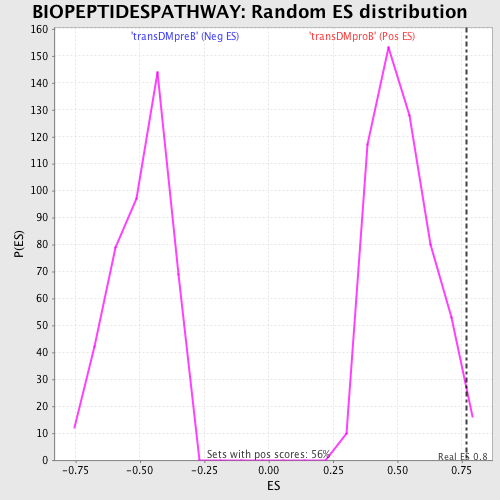
| GeneSet | BIOPEPTIDESPATHWAY |
| Enrichment Score (ES) | 0.7681452 |
| Normalized Enrichment Score (NES) | 1.4803623 |
| Nominal p-value | 0.017953321 |
| FDR q-value | 0.2712689 |
| FWER p-Value | 0.962 |
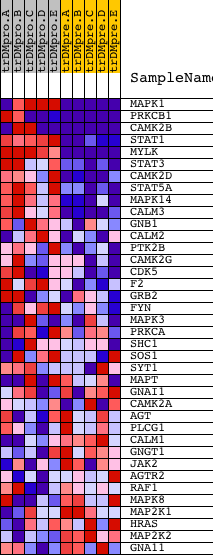
| PROBE | DESCRIPTION (from dataset) | GENE SYMBOL | GENE_TITLE | RANK IN GENE LIST | RANK METRIC SCORE | RUNNING ES | CORE ENRICHMENT | |
|---|---|---|---|---|---|---|---|---|
| 1 | MAPK1 | 1642 11167 | 80 | 2.911 | 0.1631 | Yes | ||
| 2 | PRKCB1 | 1693 9574 | 81 | 2.858 | 0.3275 | Yes | ||
| 3 | CAMK2B | 20536 | 391 | 1.552 | 0.4001 | Yes | ||
| 4 | STAT1 | 3936 5524 | 443 | 1.477 | 0.4823 | Yes | ||
| 5 | MYLK | 22778 4213 | 488 | 1.366 | 0.5585 | Yes | ||
| 6 | STAT3 | 5525 9906 | 534 | 1.263 | 0.6287 | Yes | ||
| 7 | CAMK2D | 4232 | 680 | 1.045 | 0.6810 | Yes | ||
| 8 | STAT5A | 20664 | 1181 | 0.601 | 0.6887 | Yes | ||
| 9 | MAPK14 | 23313 | 1184 | 0.600 | 0.7231 | Yes | ||
| 10 | CALM3 | 8682 | 1340 | 0.528 | 0.7451 | Yes | ||
| 11 | GNB1 | 15967 | 1745 | 0.363 | 0.7443 | Yes | ||
| 12 | CALM2 | 8681 | 1771 | 0.355 | 0.7633 | Yes | ||
| 13 | PTK2B | 21776 | 1990 | 0.287 | 0.7681 | Yes | ||
| 14 | CAMK2G | 21905 | 2283 | 0.210 | 0.7645 | No | ||
| 15 | CDK5 | 16591 | 2518 | 0.158 | 0.7610 | No | ||
| 16 | F2 | 14524 | 2685 | 0.132 | 0.7596 | No | ||
| 17 | GRB2 | 20149 | 2736 | 0.123 | 0.7640 | No | ||
| 18 | FYN | 3375 3395 20052 | 3271 | 0.066 | 0.7391 | No | ||
| 19 | MAPK3 | 6458 11170 | 4552 | 0.016 | 0.6711 | No | ||
| 20 | PRKCA | 20174 | 4949 | 0.012 | 0.6505 | No | ||
| 21 | SHC1 | 9813 9812 5430 | 4950 | 0.012 | 0.6512 | No | ||
| 22 | SOS1 | 5476 | 5657 | 0.008 | 0.6136 | No | ||
| 23 | SYT1 | 5565 | 7163 | 0.003 | 0.5328 | No | ||
| 24 | MAPT | 9420 1347 | 7406 | 0.002 | 0.5199 | No | ||
| 25 | GNAI1 | 9024 | 9645 | -0.003 | 0.3996 | No | ||
| 26 | CAMK2A | 2024 23541 1980 | 10341 | -0.005 | 0.3625 | No | ||
| 27 | AGT | 18711 | 10634 | -0.006 | 0.3471 | No | ||
| 28 | PLCG1 | 14753 | 10822 | -0.007 | 0.3374 | No | ||
| 29 | CALM1 | 21184 | 11378 | -0.008 | 0.3080 | No | ||
| 30 | GNGT1 | 17533 | 11486 | -0.009 | 0.3028 | No | ||
| 31 | JAK2 | 23893 9197 3706 | 14194 | -0.034 | 0.1591 | No | ||
| 32 | AGTR2 | 24365 | 14768 | -0.050 | 0.1311 | No | ||
| 33 | RAF1 | 17035 | 15064 | -0.065 | 0.1190 | No | ||
| 34 | MAPK8 | 6459 | 15826 | -0.132 | 0.0856 | No | ||
| 35 | MAP2K1 | 19082 | 15878 | -0.140 | 0.0909 | No | ||
| 36 | HRAS | 4868 | 16140 | -0.184 | 0.0874 | No | ||
| 37 | MAP2K2 | 19933 | 16484 | -0.264 | 0.0842 | No | ||
| 38 | GNA11 | 3300 3345 19670 | 17302 | -0.531 | 0.0707 | No |