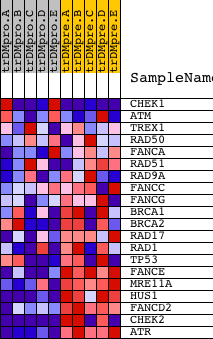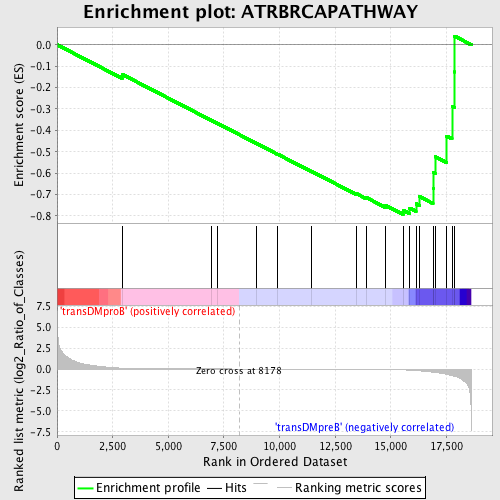
Profile of the Running ES Score & Positions of GeneSet Members on the Rank Ordered List
| Dataset | Set_04_transDMproB_versus_transDMpreB.phenotype_transDMproB_versus_transDMpreB.cls #transDMproB_versus_transDMpreB.phenotype_transDMproB_versus_transDMpreB.cls #transDMproB_versus_transDMpreB_repos |
| Phenotype | phenotype_transDMproB_versus_transDMpreB.cls#transDMproB_versus_transDMpreB_repos |
| Upregulated in class | transDMpreB |
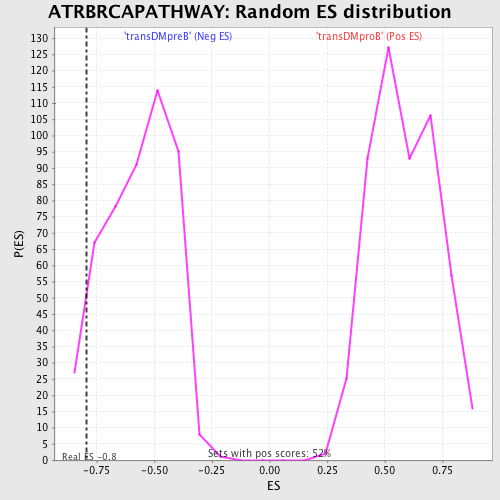
| GeneSet | ATRBRCAPATHWAY |
| Enrichment Score (ES) | -0.79340124 |
| Normalized Enrichment Score (NES) | -1.3984557 |
| Nominal p-value | 0.07068607 |
| FDR q-value | 0.47495866 |
| FWER p-Value | 1.0 |
| PROBE | DESCRIPTION (from dataset) | GENE SYMBOL | GENE_TITLE | RANK IN GENE LIST | RANK METRIC SCORE | RUNNING ES | CORE ENRICHMENT | |
|---|---|---|---|---|---|---|---|---|
| 1 | CHEK1 | 19181 3085 | 2923 | 0.098 | -0.1382 | No | ||
| 2 | ATM | 2976 19115 | 6932 | 0.003 | -0.3531 | No | ||
| 3 | TREX1 | 10219 3111 | 7207 | 0.003 | -0.3674 | No | ||
| 4 | RAD50 | 1198 20460 | 8948 | -0.002 | -0.4606 | No | ||
| 5 | FANCA | 18717 | 9919 | -0.004 | -0.5120 | No | ||
| 6 | RAD51 | 2897 14903 | 11430 | -0.009 | -0.5915 | No | ||
| 7 | RAD9A | 913 3674 910 23958 | 13453 | -0.022 | -0.6959 | No | ||
| 8 | FANCC | 4712 | 13902 | -0.029 | -0.7145 | No | ||
| 9 | FANCG | 15904 | 14774 | -0.050 | -0.7516 | No | ||
| 10 | BRCA1 | 20213 | 15553 | -0.100 | -0.7740 | Yes | ||
| 11 | BRCA2 | 16612 | 15849 | -0.135 | -0.7636 | Yes | ||
| 12 | RAD17 | 21366 | 16134 | -0.183 | -0.7434 | Yes | ||
| 13 | RAD1 | 22507 | 16289 | -0.216 | -0.7097 | Yes | ||
| 14 | TP53 | 20822 | 16897 | -0.375 | -0.6697 | Yes | ||
| 15 | FANCE | 23318 | 16905 | -0.377 | -0.5969 | Yes | ||
| 16 | MRE11A | 3014 19560 | 16995 | -0.407 | -0.5229 | Yes | ||
| 17 | HUS1 | 9138 4890 | 17515 | -0.638 | -0.4270 | Yes | ||
| 18 | FANCD2 | 17326 464 | 17751 | -0.782 | -0.2881 | Yes | ||
| 19 | CHEK2 | 16751 3587 | 17857 | -0.859 | -0.1271 | Yes | ||
| 20 | ATR | 19349 | 17864 | -0.866 | 0.0404 | Yes |