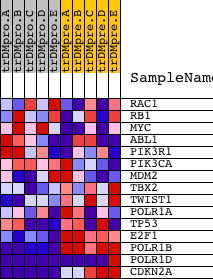
Profile of the Running ES Score & Positions of GeneSet Members on the Rank Ordered List
| Dataset | Set_04_transDMproB_versus_transDMpreB.phenotype_transDMproB_versus_transDMpreB.cls #transDMproB_versus_transDMpreB.phenotype_transDMproB_versus_transDMpreB.cls #transDMproB_versus_transDMpreB_repos |
| Phenotype | phenotype_transDMproB_versus_transDMpreB.cls#transDMproB_versus_transDMpreB_repos |
| Upregulated in class | transDMpreB |
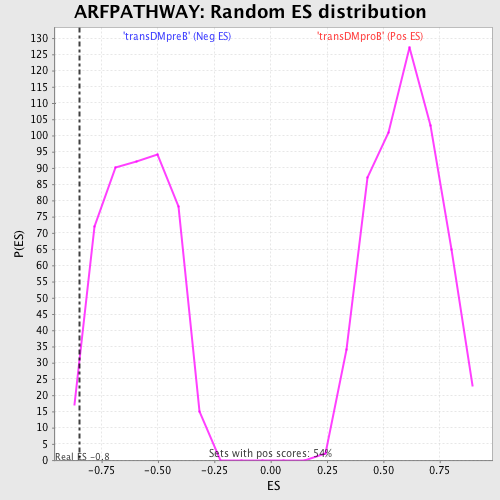
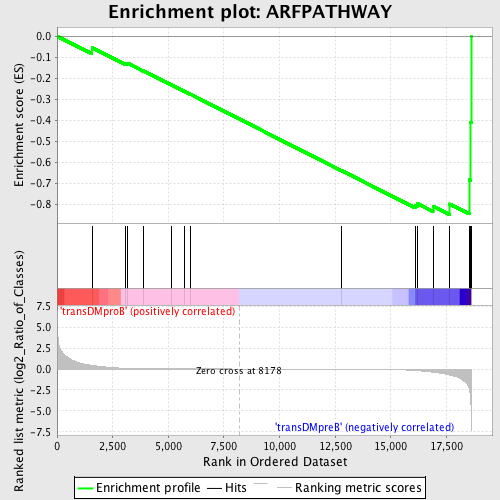
| GeneSet | ARFPATHWAY |
| Enrichment Score (ES) | -0.8495476 |
| Normalized Enrichment Score (NES) | -1.4293952 |
| Nominal p-value | 0.024017468 |
| FDR q-value | 0.47350538 |
| FWER p-Value | 1.0 |
| PROBE | DESCRIPTION (from dataset) | GENE SYMBOL | GENE_TITLE | RANK IN GENE LIST | RANK METRIC SCORE | RUNNING ES | CORE ENRICHMENT | |
|---|---|---|---|---|---|---|---|---|
| 1 | RAC1 | 16302 | 1568 | 0.428 | -0.0542 | No | ||
| 2 | RB1 | 21754 | 3086 | 0.082 | -0.1299 | No | ||
| 3 | MYC | 22465 9435 | 3151 | 0.076 | -0.1280 | No | ||
| 4 | ABL1 | 2693 4301 2794 | 3881 | 0.033 | -0.1649 | No | ||
| 5 | PIK3R1 | 3170 | 5127 | 0.011 | -0.2310 | No | ||
| 6 | PIK3CA | 9562 | 5742 | 0.007 | -0.2635 | No | ||
| 7 | MDM2 | 19620 3327 | 6002 | 0.006 | -0.2770 | No | ||
| 8 | TBX2 | 20720 | 12786 | -0.016 | -0.6405 | No | ||
| 9 | TWIST1 | 21291 | 16092 | -0.175 | -0.8059 | No | ||
| 10 | POLR1A | 9749 5393 | 16180 | -0.192 | -0.7971 | No | ||
| 11 | TP53 | 20822 | 16897 | -0.375 | -0.8092 | Yes | ||
| 12 | E2F1 | 14384 | 17648 | -0.711 | -0.7996 | Yes | ||
| 13 | POLR1B | 14857 | 18521 | -2.309 | -0.6840 | Yes | ||
| 14 | POLR1D | 3593 3658 16623 | 18596 | -3.961 | -0.4094 | Yes | ||
| 15 | CDKN2A | 2491 15841 | 18612 | -5.834 | 0.0002 | Yes |