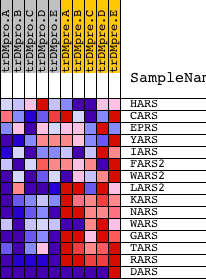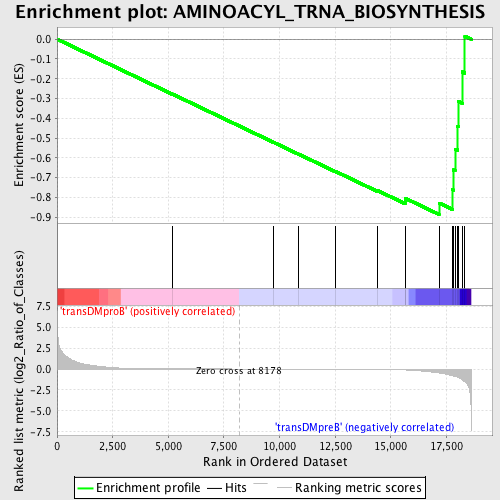
Profile of the Running ES Score & Positions of GeneSet Members on the Rank Ordered List
| Dataset | Set_04_transDMproB_versus_transDMpreB.phenotype_transDMproB_versus_transDMpreB.cls #transDMproB_versus_transDMpreB.phenotype_transDMproB_versus_transDMpreB.cls #transDMproB_versus_transDMpreB_repos |
| Phenotype | phenotype_transDMproB_versus_transDMpreB.cls#transDMproB_versus_transDMpreB_repos |
| Upregulated in class | transDMpreB |
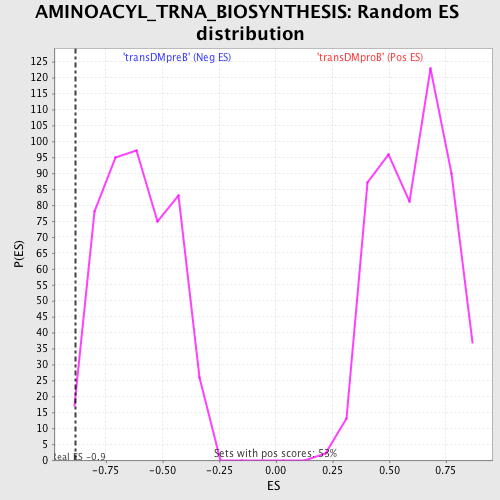
| GeneSet | AMINOACYL_TRNA_BIOSYNTHESIS |
| Enrichment Score (ES) | -0.8857954 |
| Normalized Enrichment Score (NES) | -1.4543791 |
| Nominal p-value | 0.008492569 |
| FDR q-value | 0.4553633 |
| FWER p-Value | 0.995 |
| PROBE | DESCRIPTION (from dataset) | GENE SYMBOL | GENE_TITLE | RANK IN GENE LIST | RANK METRIC SCORE | RUNNING ES | CORE ENRICHMENT | |
|---|---|---|---|---|---|---|---|---|
| 1 | HARS | 23451 | 5177 | 0.011 | -0.2770 | No | ||
| 2 | CARS | 1683 17544 | 9712 | -0.004 | -0.5203 | No | ||
| 3 | EPRS | 14014 | 10842 | -0.007 | -0.5802 | No | ||
| 4 | YARS | 16071 | 12527 | -0.014 | -0.6689 | No | ||
| 5 | IARS | 4190 8361 8362 | 14413 | -0.040 | -0.7653 | No | ||
| 6 | FARS2 | 21666 | 15647 | -0.110 | -0.8179 | No | ||
| 7 | WARS2 | 12884 7688 | 15664 | -0.112 | -0.8048 | No | ||
| 8 | LARS2 | 19255 | 17171 | -0.465 | -0.8280 | Yes | ||
| 9 | KARS | 18738 | 17777 | -0.800 | -0.7611 | Yes | ||
| 10 | NARS | 23418 | 17807 | -0.821 | -0.6607 | Yes | ||
| 11 | WARS | 2085 20984 | 17890 | -0.885 | -0.5551 | Yes | ||
| 12 | GARS | 17438 | 17998 | -0.972 | -0.4401 | Yes | ||
| 13 | TARS | 22325 8502 | 18046 | -1.030 | -0.3146 | Yes | ||
| 14 | RARS | 20496 | 18210 | -1.272 | -0.1654 | Yes | ||
| 15 | DARS | 10375 13846 | 18330 | -1.506 | 0.0154 | Yes |