Profile of the Running ES Score & Positions of GeneSet Members on the Rank Ordered List
| Dataset | Set_04_transDMproB_versus_transDMpreB.phenotype_transDMproB_versus_transDMpreB.cls #transDMproB_versus_transDMpreB.phenotype_transDMproB_versus_transDMpreB.cls #transDMproB_versus_transDMpreB_repos |
| Phenotype | phenotype_transDMproB_versus_transDMpreB.cls#transDMproB_versus_transDMpreB_repos |
| Upregulated in class | transDMpreB |
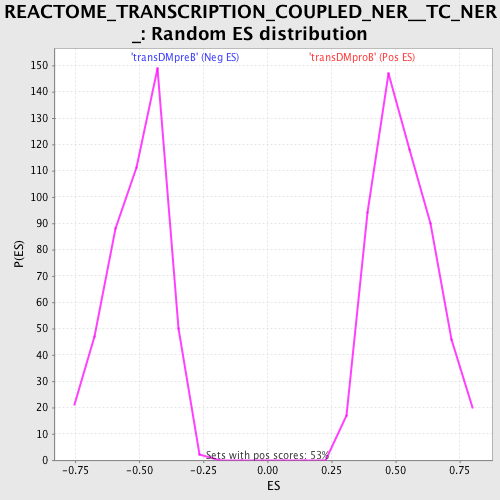
| GeneSet | REACTOME_TRANSCRIPTION_COUPLED_NER__TC_NER_ |
| Enrichment Score (ES) | -0.8327094 |
| Normalized Enrichment Score (NES) | -1.6370152 |
| Nominal p-value | 0.0 |
| FDR q-value | 0.041119836 |
| FWER p-Value | 0.204 |
| PROBE | DESCRIPTION (from dataset) | GENE SYMBOL | GENE_TITLE | RANK IN GENE LIST | RANK METRIC SCORE | RUNNING ES | CORE ENRICHMENT | |
|---|---|---|---|---|---|---|---|---|
| 1 | POLD1 | 17847 | 2346 | 0.193 | -0.1141 | No | ||
| 2 | POLR2I | 12839 | 4549 | 0.016 | -0.2316 | No | ||
| 3 | POLR2B | 16817 | 9559 | -0.003 | -0.5009 | No | ||
| 4 | POLE2 | 21053 | 10834 | -0.007 | -0.5690 | No | ||
| 5 | POLR2C | 9750 | 11129 | -0.008 | -0.5844 | No | ||
| 6 | CDK7 | 21365 | 11610 | -0.009 | -0.6096 | No | ||
| 7 | ERCC2 | 1549 18363 3812 | 12004 | -0.011 | -0.6301 | No | ||
| 8 | GTF2H1 | 4069 18236 | 12236 | -0.012 | -0.6417 | No | ||
| 9 | MNAT1 | 9396 2161 | 14660 | -0.047 | -0.7691 | No | ||
| 10 | POLD3 | 17742 | 15222 | -0.074 | -0.7946 | No | ||
| 11 | PCNA | 9535 | 15286 | -0.078 | -0.7931 | No | ||
| 12 | RPA1 | 20349 | 15720 | -0.118 | -0.8090 | No | ||
| 13 | POLR2A | 5394 | 15899 | -0.143 | -0.8096 | No | ||
| 14 | LIG1 | 18388 1749 1493 | 16164 | -0.188 | -0.8119 | No | ||
| 15 | ERCC3 | 23605 | 16551 | -0.282 | -0.8150 | Yes | ||
| 16 | CCNH | 7322 | 16640 | -0.306 | -0.8005 | Yes | ||
| 17 | RFC3 | 12786 | 16696 | -0.318 | -0.7834 | Yes | ||
| 18 | POLR2G | 23753 | 17011 | -0.414 | -0.7742 | Yes | ||
| 19 | ERCC5 | 14255 4097 | 17080 | -0.437 | -0.7504 | Yes | ||
| 20 | RFC1 | 16527 | 17146 | -0.459 | -0.7250 | Yes | ||
| 21 | RPA2 | 2330 16057 | 17200 | -0.478 | -0.6977 | Yes | ||
| 22 | POLR2J | 16672 | 17332 | -0.543 | -0.6706 | Yes | ||
| 23 | RPA3 | 12667 | 17407 | -0.581 | -0.6381 | Yes | ||
| 24 | ERCC1 | 1235 1045 1646 | 17525 | -0.643 | -0.6039 | Yes | ||
| 25 | GTF2H3 | 5551 | 17656 | -0.714 | -0.5659 | Yes | ||
| 26 | POLE | 16755 | 17734 | -0.763 | -0.5220 | Yes | ||
| 27 | GTF2H2 | 6236 | 17831 | -0.841 | -0.4743 | Yes | ||
| 28 | RFC4 | 1735 22627 | 17938 | -0.919 | -0.4221 | Yes | ||
| 29 | ERCC8 | 12982 3255 3187 | 17966 | -0.938 | -0.3645 | Yes | ||
| 30 | POLR2H | 10888 | 18041 | -1.027 | -0.3039 | Yes | ||
| 31 | POLD2 | 20537 | 18183 | -1.216 | -0.2349 | Yes | ||
| 32 | RFC5 | 13005 7791 | 18379 | -1.611 | -0.1440 | Yes | ||
| 33 | POLR2E | 3325 19699 | 18536 | -2.490 | 0.0043 | Yes |