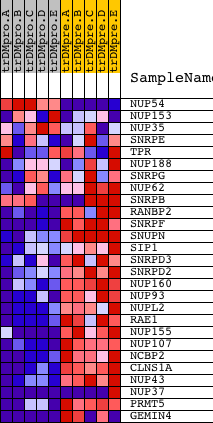
Profile of the Running ES Score & Positions of GeneSet Members on the Rank Ordered List
| Dataset | Set_04_transDMproB_versus_transDMpreB.phenotype_transDMproB_versus_transDMpreB.cls #transDMproB_versus_transDMpreB.phenotype_transDMproB_versus_transDMpreB.cls #transDMproB_versus_transDMpreB_repos |
| Phenotype | phenotype_transDMproB_versus_transDMpreB.cls#transDMproB_versus_transDMpreB_repos |
| Upregulated in class | transDMpreB |
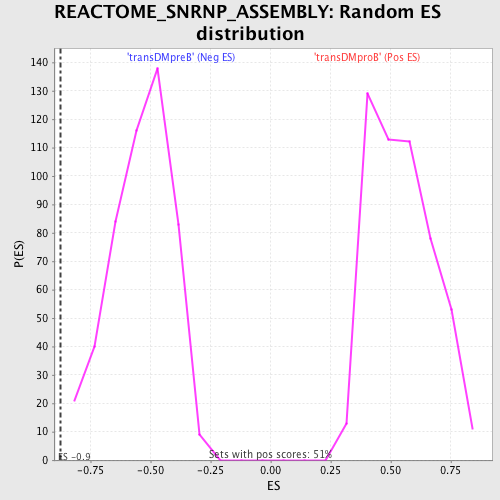
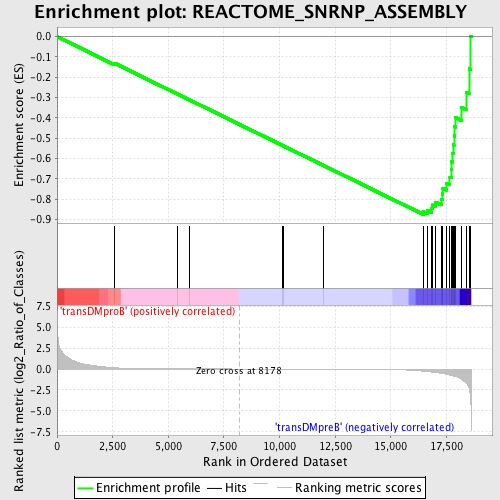
| GeneSet | REACTOME_SNRNP_ASSEMBLY |
| Enrichment Score (ES) | -0.8754831 |
| Normalized Enrichment Score (NES) | -1.6272551 |
| Nominal p-value | 0.0 |
| FDR q-value | 0.028604003 |
| FWER p-Value | 0.249 |
| PROBE | DESCRIPTION (from dataset) | GENE SYMBOL | GENE_TITLE | RANK IN GENE LIST | RANK METRIC SCORE | RUNNING ES | CORE ENRICHMENT | |
|---|---|---|---|---|---|---|---|---|
| 1 | NUP54 | 11231 11232 6516 | 2588 | 0.148 | -0.1313 | No | ||
| 2 | NUP153 | 21474 | 5427 | 0.009 | -0.2835 | No | ||
| 3 | NUP35 | 12803 | 5947 | 0.006 | -0.3111 | No | ||
| 4 | SNRPE | 9843 | 10124 | -0.005 | -0.5355 | No | ||
| 5 | TPR | 927 4255 | 10178 | -0.005 | -0.5381 | No | ||
| 6 | NUP188 | 15053 | 11974 | -0.011 | -0.6341 | No | ||
| 7 | SNRPG | 12622 | 16463 | -0.258 | -0.8618 | Yes | ||
| 8 | NUP62 | 9497 | 16635 | -0.305 | -0.8548 | Yes | ||
| 9 | SNRPB | 9842 5469 2736 | 16845 | -0.360 | -0.8469 | Yes | ||
| 10 | RANBP2 | 20019 | 16873 | -0.368 | -0.8287 | Yes | ||
| 11 | SNRPF | 7645 | 17025 | -0.419 | -0.8145 | Yes | ||
| 12 | SNUPN | 12282 | 17280 | -0.516 | -0.8008 | Yes | ||
| 13 | SIP1 | 21263 | 17307 | -0.533 | -0.7738 | Yes | ||
| 14 | SNRPD3 | 12514 | 17340 | -0.547 | -0.7464 | Yes | ||
| 15 | SNRPD2 | 8412 | 17505 | -0.632 | -0.7216 | Yes | ||
| 16 | NUP160 | 14957 | 17655 | -0.714 | -0.6916 | Yes | ||
| 17 | NUP93 | 7762 | 17714 | -0.747 | -0.6550 | Yes | ||
| 18 | NUPL2 | 6072 | 17738 | -0.766 | -0.6155 | Yes | ||
| 19 | RAE1 | 12395 | 17785 | -0.807 | -0.5751 | Yes | ||
| 20 | NUP155 | 2298 5027 | 17820 | -0.829 | -0.5328 | Yes | ||
| 21 | NUP107 | 8337 | 17842 | -0.849 | -0.4888 | Yes | ||
| 22 | NCBP2 | 12643 | 17873 | -0.871 | -0.4440 | Yes | ||
| 23 | CLNS1A | 4526 4525 | 17901 | -0.896 | -0.3978 | Yes | ||
| 24 | NUP43 | 20094 | 18171 | -1.199 | -0.3485 | Yes | ||
| 25 | NUP37 | 3294 3326 19909 | 18384 | -1.613 | -0.2741 | Yes | ||
| 26 | PRMT5 | 6571 2817 | 18519 | -2.302 | -0.1589 | Yes | ||
| 27 | GEMIN4 | 6592 6591 | 18571 | -3.083 | 0.0024 | Yes |