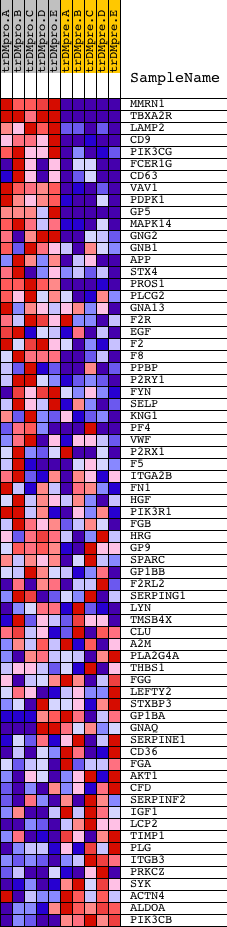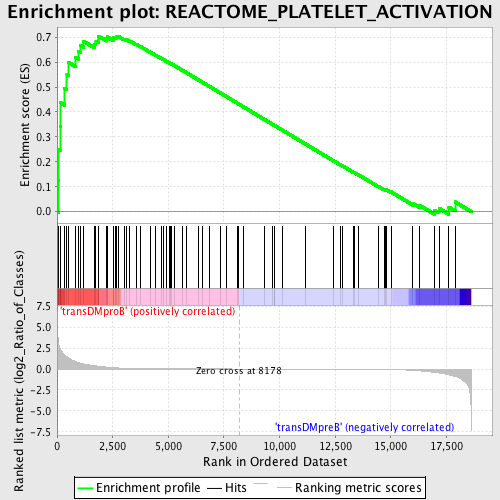
Profile of the Running ES Score & Positions of GeneSet Members on the Rank Ordered List
| Dataset | Set_04_transDMproB_versus_transDMpreB.phenotype_transDMproB_versus_transDMpreB.cls #transDMproB_versus_transDMpreB.phenotype_transDMproB_versus_transDMpreB.cls #transDMproB_versus_transDMpreB_repos |
| Phenotype | phenotype_transDMproB_versus_transDMpreB.cls#transDMproB_versus_transDMpreB_repos |
| Upregulated in class | transDMproB |
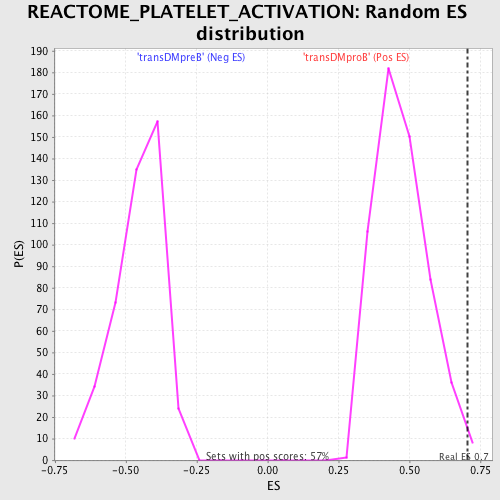
| GeneSet | REACTOME_PLATELET_ACTIVATION |
| Enrichment Score (ES) | 0.704329 |
| Normalized Enrichment Score (NES) | 1.4974661 |
| Nominal p-value | 0.01058201 |
| FDR q-value | 0.27409336 |
| FWER p-Value | 0.976 |
| PROBE | DESCRIPTION (from dataset) | GENE SYMBOL | GENE_TITLE | RANK IN GENE LIST | RANK METRIC SCORE | RUNNING ES | CORE ENRICHMENT | |
|---|---|---|---|---|---|---|---|---|
| 1 | MMRN1 | 17428 | 59 | 3.200 | 0.1269 | Yes | ||
| 2 | TBXA2R | 3392 19928 | 70 | 3.042 | 0.2500 | Yes | ||
| 3 | LAMP2 | 9267 2653 | 136 | 2.390 | 0.3436 | Yes | ||
| 4 | CD9 | 16992 | 148 | 2.330 | 0.4378 | Yes | ||
| 5 | PIK3CG | 6635 | 341 | 1.639 | 0.4940 | Yes | ||
| 6 | FCER1G | 13759 | 442 | 1.480 | 0.5488 | Yes | ||
| 7 | CD63 | 8716 | 504 | 1.327 | 0.5994 | Yes | ||
| 8 | VAV1 | 23173 | 813 | 0.905 | 0.6196 | Yes | ||
| 9 | PDPK1 | 23097 | 950 | 0.777 | 0.6439 | Yes | ||
| 10 | GP5 | 22616 | 1037 | 0.698 | 0.6676 | Yes | ||
| 11 | MAPK14 | 23313 | 1184 | 0.600 | 0.6841 | Yes | ||
| 12 | GNG2 | 4790 | 1691 | 0.382 | 0.6723 | Yes | ||
| 13 | GNB1 | 15967 | 1745 | 0.363 | 0.6842 | Yes | ||
| 14 | APP | 4402 | 1860 | 0.324 | 0.6912 | Yes | ||
| 15 | STX4 | 18062 | 1862 | 0.323 | 0.7043 | Yes | ||
| 16 | PROS1 | 22725 | 2227 | 0.221 | 0.6937 | No | ||
| 17 | PLCG2 | 18453 | 2251 | 0.216 | 0.7013 | No | ||
| 18 | GNA13 | 20617 | 2536 | 0.156 | 0.6923 | No | ||
| 19 | F2R | 21386 | 2542 | 0.155 | 0.6983 | No | ||
| 20 | EGF | 15169 | 2619 | 0.142 | 0.7000 | No | ||
| 21 | F2 | 14524 | 2685 | 0.132 | 0.7018 | No | ||
| 22 | F8 | 2584 24123 | 2765 | 0.118 | 0.7024 | No | ||
| 23 | PPBP | 16801 | 3013 | 0.089 | 0.6926 | No | ||
| 24 | P2RY1 | 15581 | 3103 | 0.081 | 0.6911 | No | ||
| 25 | FYN | 3375 3395 20052 | 3271 | 0.066 | 0.6848 | No | ||
| 26 | SELP | 14073 | 3555 | 0.047 | 0.6714 | No | ||
| 27 | KNG1 | 9244 22809 | 3757 | 0.037 | 0.6621 | No | ||
| 28 | PF4 | 16800 | 4202 | 0.023 | 0.6391 | No | ||
| 29 | VWF | 17277 | 4433 | 0.018 | 0.6275 | No | ||
| 30 | P2RX1 | 20794 1294 | 4682 | 0.015 | 0.6147 | No | ||
| 31 | F5 | 8941 | 4790 | 0.014 | 0.6095 | No | ||
| 32 | ITGA2B | 9186 | 4925 | 0.012 | 0.6028 | No | ||
| 33 | FN1 | 4091 4094 971 13929 | 5066 | 0.011 | 0.5957 | No | ||
| 34 | HGF | 16916 | 5075 | 0.011 | 0.5957 | No | ||
| 35 | PIK3R1 | 3170 | 5127 | 0.011 | 0.5934 | No | ||
| 36 | FGB | 15309 | 5268 | 0.010 | 0.5862 | No | ||
| 37 | HRG | 22810 | 5632 | 0.008 | 0.5670 | No | ||
| 38 | GP9 | 17374 | 5816 | 0.007 | 0.5574 | No | ||
| 39 | SPARC | 20444 | 6371 | 0.005 | 0.5277 | No | ||
| 40 | GP1BB | 9031 | 6544 | 0.004 | 0.5187 | No | ||
| 41 | F2RL2 | 21580 | 6858 | 0.003 | 0.5019 | No | ||
| 42 | SERPING1 | 14546 | 7359 | 0.002 | 0.4750 | No | ||
| 43 | LYN | 16281 | 7607 | 0.002 | 0.4618 | No | ||
| 44 | TMSB4X | 24005 | 8116 | 0.000 | 0.4344 | No | ||
| 45 | CLU | 21979 | 8159 | 0.000 | 0.4321 | No | ||
| 46 | A2M | 17298 | 8372 | -0.000 | 0.4207 | No | ||
| 47 | PLA2G4A | 13809 | 9332 | -0.003 | 0.3691 | No | ||
| 48 | THBS1 | 5748 14910 | 9687 | -0.003 | 0.3502 | No | ||
| 49 | FGG | 1891 | 9758 | -0.004 | 0.3466 | No | ||
| 50 | LEFTY2 | 6735 | 9781 | -0.004 | 0.3455 | No | ||
| 51 | STXBP3 | 9931 | 10128 | -0.005 | 0.3271 | No | ||
| 52 | GP1BA | 13683 | 11175 | -0.008 | 0.2710 | No | ||
| 53 | GNAQ | 4786 23909 3685 | 12410 | -0.013 | 0.2050 | No | ||
| 54 | SERPINE1 | 16333 | 12730 | -0.015 | 0.1884 | No | ||
| 55 | CD36 | 8712 | 12827 | -0.016 | 0.1839 | No | ||
| 56 | FGA | 1780 15566 | 13311 | -0.020 | 0.1587 | No | ||
| 57 | AKT1 | 8568 | 13355 | -0.021 | 0.1572 | No | ||
| 58 | CFD | 19957 | 13545 | -0.023 | 0.1480 | No | ||
| 59 | SERPINF2 | 9589 20348 | 14435 | -0.040 | 0.1017 | No | ||
| 60 | IGF1 | 3352 9156 3409 | 14702 | -0.048 | 0.0893 | No | ||
| 61 | LCP2 | 4988 9268 | 14777 | -0.050 | 0.0873 | No | ||
| 62 | TIMP1 | 24366 | 14796 | -0.051 | 0.0885 | No | ||
| 63 | PLG | 1593 23383 | 15008 | -0.061 | 0.0796 | No | ||
| 64 | ITGB3 | 20631 | 15994 | -0.158 | 0.0329 | No | ||
| 65 | PRKCZ | 5260 | 16309 | -0.219 | 0.0249 | No | ||
| 66 | SYK | 21636 | 16978 | -0.400 | 0.0051 | No | ||
| 67 | ACTN4 | 17905 1798 1983 | 17166 | -0.464 | 0.0139 | No | ||
| 68 | ALDOA | 8572 | 17609 | -0.694 | 0.0183 | No | ||
| 69 | PIK3CB | 19030 | 17889 | -0.885 | 0.0392 | No |