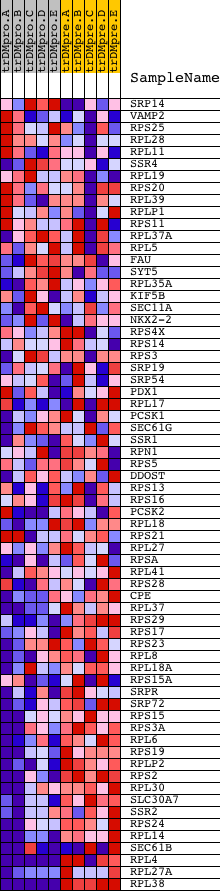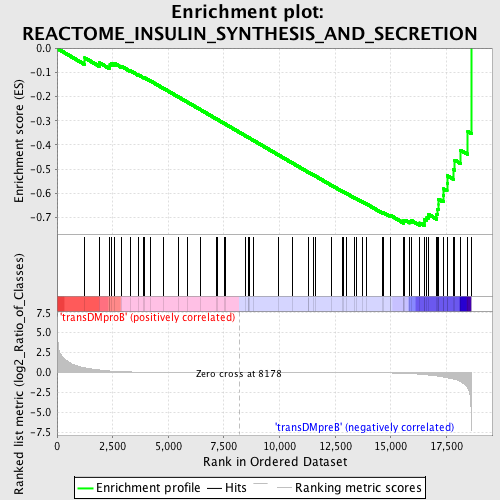
Profile of the Running ES Score & Positions of GeneSet Members on the Rank Ordered List
| Dataset | Set_04_transDMproB_versus_transDMpreB.phenotype_transDMproB_versus_transDMpreB.cls #transDMproB_versus_transDMpreB.phenotype_transDMproB_versus_transDMpreB.cls #transDMproB_versus_transDMpreB_repos |
| Phenotype | phenotype_transDMproB_versus_transDMpreB.cls#transDMproB_versus_transDMpreB_repos |
| Upregulated in class | transDMpreB |
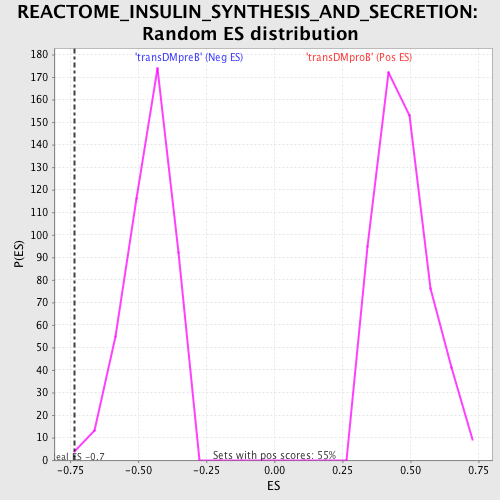
| GeneSet | REACTOME_INSULIN_SYNTHESIS_AND_SECRETION |
| Enrichment Score (ES) | -0.7341056 |
| Normalized Enrichment Score (NES) | -1.5990222 |
| Nominal p-value | 0.002202643 |
| FDR q-value | 0.03769074 |
| FWER p-Value | 0.416 |
| PROBE | DESCRIPTION (from dataset) | GENE SYMBOL | GENE_TITLE | RANK IN GENE LIST | RANK METRIC SCORE | RUNNING ES | CORE ENRICHMENT | |
|---|---|---|---|---|---|---|---|---|
| 1 | SRP14 | 9894 | 1247 | 0.571 | -0.0395 | No | ||
| 2 | VAMP2 | 20826 | 1897 | 0.314 | -0.0592 | No | ||
| 3 | RPS25 | 13270 | 2373 | 0.186 | -0.0758 | No | ||
| 4 | RPL28 | 5392 | 2376 | 0.185 | -0.0668 | No | ||
| 5 | RPL11 | 12450 | 2440 | 0.173 | -0.0618 | No | ||
| 6 | SSR4 | 24303 5519 | 2583 | 0.149 | -0.0622 | No | ||
| 7 | RPL19 | 9736 | 2905 | 0.100 | -0.0747 | No | ||
| 8 | RPS20 | 7438 | 3297 | 0.063 | -0.0927 | No | ||
| 9 | RPL39 | 12496 | 3657 | 0.042 | -0.1100 | No | ||
| 10 | RPLP1 | 3010 | 3895 | 0.032 | -0.1212 | No | ||
| 11 | RPS11 | 11317 | 3922 | 0.031 | -0.1211 | No | ||
| 12 | RPL37A | 9744 | 4210 | 0.023 | -0.1355 | No | ||
| 13 | RPL5 | 9746 | 4800 | 0.014 | -0.1665 | No | ||
| 14 | FAU | 8954 | 5444 | 0.009 | -0.2008 | No | ||
| 15 | SYT5 | 17986 | 5860 | 0.007 | -0.2228 | No | ||
| 16 | RPL35A | 12194 | 6445 | 0.005 | -0.2541 | No | ||
| 17 | KIF5B | 4955 2031 | 7182 | 0.003 | -0.2936 | No | ||
| 18 | SEC11A | 12144 | 7213 | 0.002 | -0.2951 | No | ||
| 19 | NKX2-2 | 5176 | 7544 | 0.002 | -0.3128 | No | ||
| 20 | RPS4X | 9756 | 7586 | 0.002 | -0.3150 | No | ||
| 21 | RPS14 | 9751 | 8450 | -0.001 | -0.3614 | No | ||
| 22 | RPS3 | 6549 11295 | 8616 | -0.001 | -0.3703 | No | ||
| 23 | SRP19 | 2004 12341 | 8620 | -0.001 | -0.3704 | No | ||
| 24 | SRP54 | 6282 | 8649 | -0.001 | -0.3719 | No | ||
| 25 | PDX1 | 16621 | 8805 | -0.001 | -0.3801 | No | ||
| 26 | RPL17 | 11429 6653 | 9960 | -0.004 | -0.4421 | No | ||
| 27 | PCSK1 | 21600 | 10560 | -0.006 | -0.4742 | No | ||
| 28 | SEC61G | 9795 | 11279 | -0.008 | -0.5125 | No | ||
| 29 | SSR1 | 4211 | 11309 | -0.008 | -0.5136 | No | ||
| 30 | RPN1 | 17371 | 11528 | -0.009 | -0.5249 | No | ||
| 31 | RPS5 | 18391 | 11625 | -0.009 | -0.5297 | No | ||
| 32 | DDOST | 16021 | 12336 | -0.013 | -0.5673 | No | ||
| 33 | RPS13 | 12633 | 12823 | -0.016 | -0.5927 | No | ||
| 34 | RPS16 | 9752 | 12850 | -0.016 | -0.5933 | No | ||
| 35 | PCSK2 | 9537 5231 14824 | 12993 | -0.017 | -0.6001 | No | ||
| 36 | RPL18 | 450 5390 | 13376 | -0.021 | -0.6197 | No | ||
| 37 | RPS21 | 12356 | 13451 | -0.022 | -0.6226 | No | ||
| 38 | RPL27 | 9740 | 13710 | -0.026 | -0.6353 | No | ||
| 39 | RPSA | 19270 4984 | 13895 | -0.028 | -0.6438 | No | ||
| 40 | RPL41 | 12611 | 14629 | -0.046 | -0.6811 | No | ||
| 41 | RPS28 | 12009 | 14674 | -0.047 | -0.6812 | No | ||
| 42 | CPE | 18868 | 14975 | -0.059 | -0.6945 | No | ||
| 43 | RPL37 | 12502 7421 22521 | 14998 | -0.061 | -0.6927 | No | ||
| 44 | RPS29 | 9754 | 15581 | -0.102 | -0.7191 | No | ||
| 45 | RPS17 | 9753 | 15582 | -0.102 | -0.7141 | No | ||
| 46 | RPS23 | 12352 | 15635 | -0.110 | -0.7116 | No | ||
| 47 | RPL8 | 22437 | 15856 | -0.136 | -0.7169 | No | ||
| 48 | RPL18A | 13358 | 15931 | -0.146 | -0.7137 | No | ||
| 49 | RPS15A | 6476 | 16310 | -0.220 | -0.7234 | Yes | ||
| 50 | SRPR | 12525 7433 | 16501 | -0.269 | -0.7206 | Yes | ||
| 51 | SRP72 | 16819 | 16506 | -0.270 | -0.7077 | Yes | ||
| 52 | RPS15 | 5396 | 16622 | -0.299 | -0.6994 | Yes | ||
| 53 | RPS3A | 9755 | 16692 | -0.318 | -0.6877 | Yes | ||
| 54 | RPL6 | 9747 | 17067 | -0.434 | -0.6867 | Yes | ||
| 55 | RPS19 | 5398 | 17101 | -0.445 | -0.6669 | Yes | ||
| 56 | RPLP2 | 7401 | 17142 | -0.459 | -0.6467 | Yes | ||
| 57 | RPS2 | 9279 | 17144 | -0.459 | -0.6245 | Yes | ||
| 58 | RPL30 | 9742 | 17366 | -0.561 | -0.6091 | Yes | ||
| 59 | SLC30A7 | 15186 | 17381 | -0.570 | -0.5822 | Yes | ||
| 60 | SSR2 | 15549 | 17527 | -0.643 | -0.5587 | Yes | ||
| 61 | RPS24 | 5399 | 17548 | -0.655 | -0.5279 | Yes | ||
| 62 | RPL14 | 19267 | 17812 | -0.822 | -0.5021 | Yes | ||
| 63 | SEC61B | 12305 7266 | 17876 | -0.875 | -0.4630 | Yes | ||
| 64 | RPL4 | 7499 19411 | 18126 | -1.136 | -0.4212 | Yes | ||
| 65 | RPL27A | 11181 6467 18130 | 18462 | -1.936 | -0.3452 | Yes | ||
| 66 | RPL38 | 12562 20606 7475 | 18616 | -7.271 | -0.0000 | Yes |