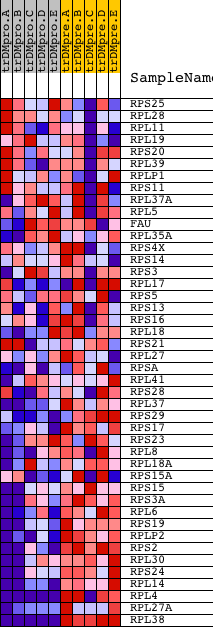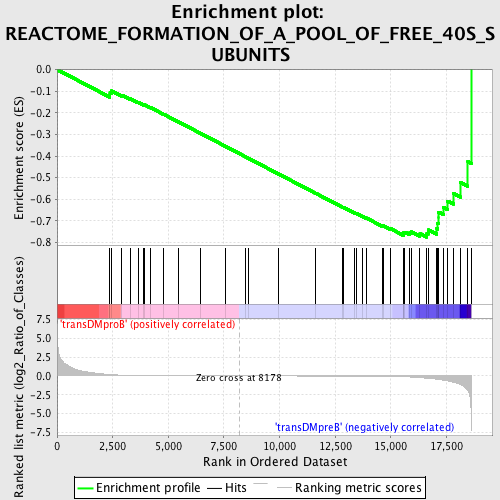
Profile of the Running ES Score & Positions of GeneSet Members on the Rank Ordered List
| Dataset | Set_04_transDMproB_versus_transDMpreB.phenotype_transDMproB_versus_transDMpreB.cls #transDMproB_versus_transDMpreB.phenotype_transDMproB_versus_transDMpreB.cls #transDMproB_versus_transDMpreB_repos |
| Phenotype | phenotype_transDMproB_versus_transDMpreB.cls#transDMproB_versus_transDMpreB_repos |
| Upregulated in class | transDMpreB |
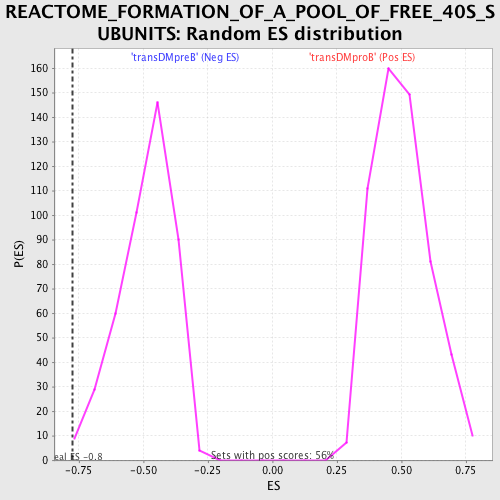
| GeneSet | REACTOME_FORMATION_OF_A_POOL_OF_FREE_40S_SUBUNITS |
| Enrichment Score (ES) | -0.77522504 |
| Normalized Enrichment Score (NES) | -1.5820692 |
| Nominal p-value | 0.009111618 |
| FDR q-value | 0.045121863 |
| FWER p-Value | 0.562 |
| PROBE | DESCRIPTION (from dataset) | GENE SYMBOL | GENE_TITLE | RANK IN GENE LIST | RANK METRIC SCORE | RUNNING ES | CORE ENRICHMENT | |
|---|---|---|---|---|---|---|---|---|
| 1 | RPS25 | 13270 | 2373 | 0.186 | -0.1167 | No | ||
| 2 | RPL28 | 5392 | 2376 | 0.185 | -0.1057 | No | ||
| 3 | RPL11 | 12450 | 2440 | 0.173 | -0.0988 | No | ||
| 4 | RPL19 | 9736 | 2905 | 0.100 | -0.1178 | No | ||
| 5 | RPS20 | 7438 | 3297 | 0.063 | -0.1351 | No | ||
| 6 | RPL39 | 12496 | 3657 | 0.042 | -0.1520 | No | ||
| 7 | RPLP1 | 3010 | 3895 | 0.032 | -0.1628 | No | ||
| 8 | RPS11 | 11317 | 3922 | 0.031 | -0.1623 | No | ||
| 9 | RPL37A | 9744 | 4210 | 0.023 | -0.1764 | No | ||
| 10 | RPL5 | 9746 | 4800 | 0.014 | -0.2073 | No | ||
| 11 | FAU | 8954 | 5444 | 0.009 | -0.2414 | No | ||
| 12 | RPL35A | 12194 | 6445 | 0.005 | -0.2949 | No | ||
| 13 | RPS4X | 9756 | 7586 | 0.002 | -0.3562 | No | ||
| 14 | RPS14 | 9751 | 8450 | -0.001 | -0.4027 | No | ||
| 15 | RPS3 | 6549 11295 | 8616 | -0.001 | -0.4115 | No | ||
| 16 | RPL17 | 11429 6653 | 9960 | -0.004 | -0.4835 | No | ||
| 17 | RPS5 | 18391 | 11625 | -0.009 | -0.5726 | No | ||
| 18 | RPS13 | 12633 | 12823 | -0.016 | -0.6361 | No | ||
| 19 | RPS16 | 9752 | 12850 | -0.016 | -0.6365 | No | ||
| 20 | RPL18 | 450 5390 | 13376 | -0.021 | -0.6635 | No | ||
| 21 | RPS21 | 12356 | 13451 | -0.022 | -0.6662 | No | ||
| 22 | RPL27 | 9740 | 13710 | -0.026 | -0.6785 | No | ||
| 23 | RPSA | 19270 4984 | 13895 | -0.028 | -0.6867 | No | ||
| 24 | RPL41 | 12611 | 14629 | -0.046 | -0.7235 | No | ||
| 25 | RPS28 | 12009 | 14674 | -0.047 | -0.7230 | No | ||
| 26 | RPL37 | 12502 7421 22521 | 14998 | -0.061 | -0.7368 | No | ||
| 27 | RPS29 | 9754 | 15581 | -0.102 | -0.7621 | Yes | ||
| 28 | RPS17 | 9753 | 15582 | -0.102 | -0.7560 | Yes | ||
| 29 | RPS23 | 12352 | 15635 | -0.110 | -0.7522 | Yes | ||
| 30 | RPL8 | 22437 | 15856 | -0.136 | -0.7560 | Yes | ||
| 31 | RPL18A | 13358 | 15931 | -0.146 | -0.7512 | Yes | ||
| 32 | RPS15A | 6476 | 16310 | -0.220 | -0.7585 | Yes | ||
| 33 | RPS15 | 5396 | 16622 | -0.299 | -0.7574 | Yes | ||
| 34 | RPS3A | 9755 | 16692 | -0.318 | -0.7422 | Yes | ||
| 35 | RPL6 | 9747 | 17067 | -0.434 | -0.7364 | Yes | ||
| 36 | RPS19 | 5398 | 17101 | -0.445 | -0.7117 | Yes | ||
| 37 | RPLP2 | 7401 | 17142 | -0.459 | -0.6865 | Yes | ||
| 38 | RPS2 | 9279 | 17144 | -0.459 | -0.6592 | Yes | ||
| 39 | RPL30 | 9742 | 17366 | -0.561 | -0.6376 | Yes | ||
| 40 | RPS24 | 5399 | 17548 | -0.655 | -0.6083 | Yes | ||
| 41 | RPL14 | 19267 | 17812 | -0.822 | -0.5735 | Yes | ||
| 42 | RPL4 | 7499 19411 | 18126 | -1.136 | -0.5226 | Yes | ||
| 43 | RPL27A | 11181 6467 18130 | 18462 | -1.936 | -0.4252 | Yes | ||
| 44 | RPL38 | 12562 20606 7475 | 18616 | -7.271 | -0.0000 | Yes |