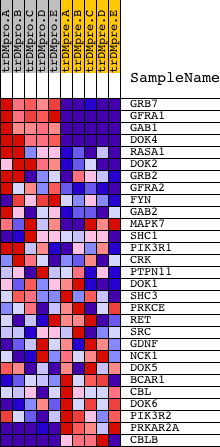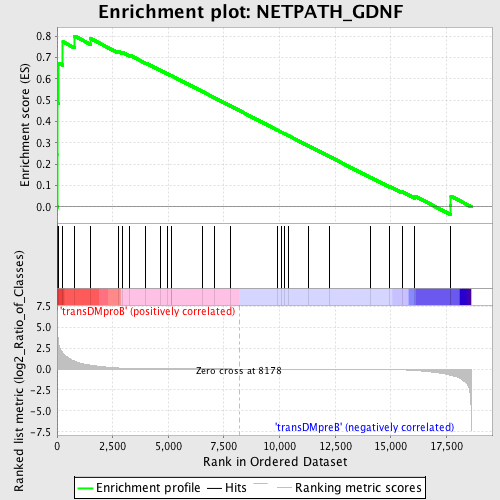
Profile of the Running ES Score & Positions of GeneSet Members on the Rank Ordered List
| Dataset | Set_04_transDMproB_versus_transDMpreB.phenotype_transDMproB_versus_transDMpreB.cls #transDMproB_versus_transDMpreB.phenotype_transDMproB_versus_transDMpreB.cls #transDMproB_versus_transDMpreB_repos |
| Phenotype | phenotype_transDMproB_versus_transDMpreB.cls#transDMproB_versus_transDMpreB_repos |
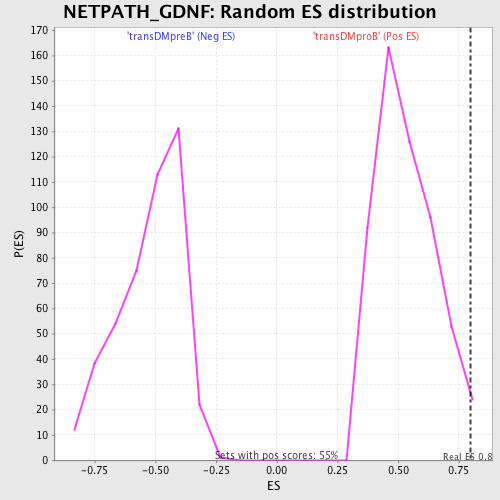
| Upregulated in class | transDMproB |
| GeneSet | NETPATH_GDNF |
| Enrichment Score (ES) | 0.7996594 |
| Normalized Enrichment Score (NES) | 1.4977435 |
| Nominal p-value | 0.016245488 |
| FDR q-value | 0.2922411 |
| FWER p-Value | 0.975 |
| PROBE | DESCRIPTION (from dataset) | GENE SYMBOL | GENE_TITLE | RANK IN GENE LIST | RANK METRIC SCORE | RUNNING ES | CORE ENRICHMENT | |
|---|---|---|---|---|---|---|---|---|
| 1 | GRB7 | 20673 | 25 | 4.169 | 0.2434 | Yes | ||
| 2 | GFRA1 | 9015 | 28 | 4.130 | 0.4858 | Yes | ||
| 3 | GAB1 | 18828 | 58 | 3.226 | 0.6736 | Yes | ||
| 4 | DOK4 | 18785 | 263 | 1.873 | 0.7726 | Yes | ||
| 5 | RASA1 | 10174 | 782 | 0.936 | 0.7997 | Yes | ||
| 6 | DOK2 | 354 | 1495 | 0.462 | 0.7885 | No | ||
| 7 | GRB2 | 20149 | 2736 | 0.123 | 0.7290 | No | ||
| 8 | GFRA2 | 21965 | 2957 | 0.095 | 0.7228 | No | ||
| 9 | FYN | 3375 3395 20052 | 3271 | 0.066 | 0.7098 | No | ||
| 10 | GAB2 | 1821 18184 2025 | 3992 | 0.029 | 0.6728 | No | ||
| 11 | MAPK7 | 1381 20414 | 4636 | 0.015 | 0.6391 | No | ||
| 12 | SHC1 | 9813 9812 5430 | 4950 | 0.012 | 0.6229 | No | ||
| 13 | PIK3R1 | 3170 | 5127 | 0.011 | 0.6141 | No | ||
| 14 | CRK | 4559 1249 | 5134 | 0.011 | 0.6144 | No | ||
| 15 | PTPN11 | 5326 16391 9660 | 6520 | 0.004 | 0.5402 | No | ||
| 16 | DOK1 | 17104 1018 1177 | 7086 | 0.003 | 0.5099 | No | ||
| 17 | SHC3 | 21465 | 7798 | 0.001 | 0.4717 | No | ||
| 18 | PRKCE | 9575 | 9884 | -0.004 | 0.3598 | No | ||
| 19 | RET | 17028 | 10096 | -0.004 | 0.3487 | No | ||
| 20 | SRC | 5507 | 10223 | -0.005 | 0.3422 | No | ||
| 21 | GDNF | 22514 2275 | 10398 | -0.005 | 0.3332 | No | ||
| 22 | NCK1 | 9447 5152 | 11280 | -0.008 | 0.2862 | No | ||
| 23 | DOK5 | 2945 14722 | 12259 | -0.013 | 0.2344 | No | ||
| 24 | BCAR1 | 18741 | 14082 | -0.032 | 0.1382 | No | ||
| 25 | CBL | 19154 | 14950 | -0.058 | 0.0950 | No | ||
| 26 | DOK6 | 509 | 15505 | -0.095 | 0.0707 | No | ||
| 27 | PIK3R2 | 18850 | 16073 | -0.170 | 0.0502 | No | ||
| 28 | PRKAR2A | 5287 | 17679 | -0.732 | 0.0068 | No | ||
| 29 | CBLB | 5531 22734 | 17702 | -0.742 | 0.0492 | No |