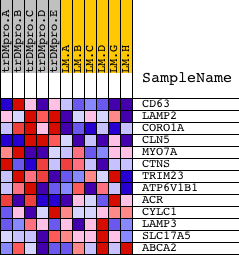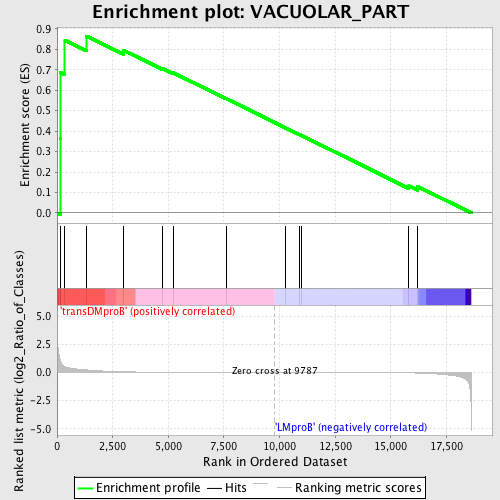
Profile of the Running ES Score & Positions of GeneSet Members on the Rank Ordered List
| Dataset | Set_04_transDMproB_versus_LMproB.phenotype_transDMproB_versus_LMproB.cls #transDMproB_versus_LMproB |
| Phenotype | phenotype_transDMproB_versus_LMproB.cls#transDMproB_versus_LMproB |
| Upregulated in class | transDMproB |
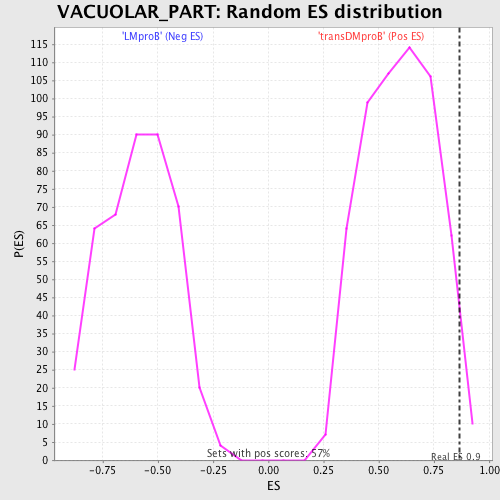
| GeneSet | VACUOLAR_PART |
| Enrichment Score (ES) | 0.86464256 |
| Normalized Enrichment Score (NES) | 1.4556842 |
| Nominal p-value | 0.028119508 |
| FDR q-value | 1.0 |
| FWER p-Value | 1.0 |
| PROBE | DESCRIPTION (from dataset) | GENE SYMBOL | GENE_TITLE | RANK IN GENE LIST | RANK METRIC SCORE | RUNNING ES | CORE ENRICHMENT | |
|---|---|---|---|---|---|---|---|---|
| 1 | CD63 | 8716 | 137 | 1.127 | 0.3635 | Yes | ||
| 2 | LAMP2 | 9267 2653 | 162 | 0.982 | 0.6854 | Yes | ||
| 3 | CORO1A | 1066 17631 1074 | 353 | 0.515 | 0.8448 | Yes | ||
| 4 | CLN5 | 21943 | 1333 | 0.220 | 0.8646 | Yes | ||
| 5 | MYO7A | 9439 | 2990 | 0.059 | 0.7951 | No | ||
| 6 | CTNS | 13503 | 4746 | 0.017 | 0.7065 | No | ||
| 7 | TRIM23 | 8165 3230 | 5228 | 0.014 | 0.6851 | No | ||
| 8 | ATP6V1B1 | 8499 | 7594 | 0.004 | 0.5595 | No | ||
| 9 | ACR | 22384 8529 | 10249 | -0.001 | 0.4171 | No | ||
| 10 | CYLC1 | 12526 | 10873 | -0.002 | 0.3843 | No | ||
| 11 | LAMP3 | 10747 6259 6260 | 10976 | -0.002 | 0.3795 | No | ||
| 12 | SLC17A5 | 19055 | 15813 | -0.038 | 0.1321 | No | ||
| 13 | ABCA2 | 15083 | 16212 | -0.056 | 0.1292 | No |