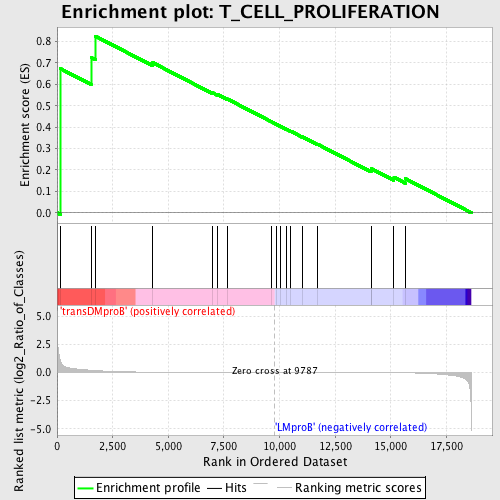
Profile of the Running ES Score & Positions of GeneSet Members on the Rank Ordered List
| Dataset | Set_04_transDMproB_versus_LMproB.phenotype_transDMproB_versus_LMproB.cls #transDMproB_versus_LMproB |
| Phenotype | phenotype_transDMproB_versus_LMproB.cls#transDMproB_versus_LMproB |
| Upregulated in class | transDMproB |
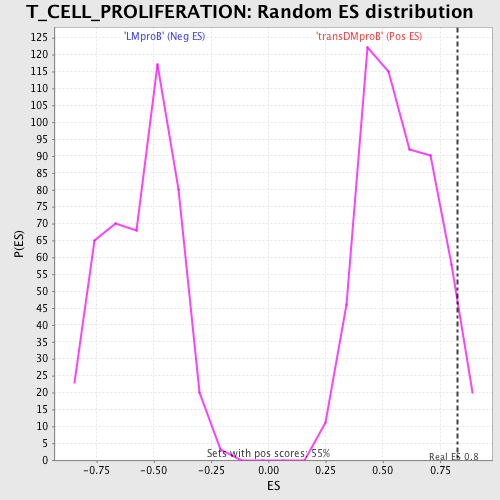
| GeneSet | T_CELL_PROLIFERATION |
| Enrichment Score (ES) | 0.82532877 |
| Normalized Enrichment Score (NES) | 1.451876 |
| Nominal p-value | 0.050541516 |
| FDR q-value | 1.0 |
| FWER p-Value | 1.0 |
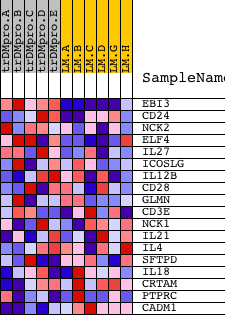
| PROBE | DESCRIPTION (from dataset) | GENE SYMBOL | GENE_TITLE | RANK IN GENE LIST | RANK METRIC SCORE | RUNNING ES | CORE ENRICHMENT | |
|---|---|---|---|---|---|---|---|---|
| 1 | EBI3 | 23193 | 152 | 1.034 | 0.6730 | Yes | ||
| 2 | CD24 | 8711 | 1532 | 0.192 | 0.7251 | Yes | ||
| 3 | NCK2 | 9448 | 1716 | 0.167 | 0.8253 | Yes | ||
| 4 | ELF4 | 24162 | 4302 | 0.022 | 0.7010 | No | ||
| 5 | IL27 | 17636 | 6962 | 0.006 | 0.5620 | No | ||
| 6 | ICOSLG | 19973 | 7199 | 0.006 | 0.5530 | No | ||
| 7 | IL12B | 20918 | 7650 | 0.004 | 0.5316 | No | ||
| 8 | CD28 | 14239 4092 | 9636 | 0.000 | 0.4251 | No | ||
| 9 | GLMN | 16452 3562 | 9854 | -0.000 | 0.4135 | No | ||
| 10 | CD3E | 8714 | 10062 | -0.001 | 0.4028 | No | ||
| 11 | NCK1 | 9447 5152 | 10315 | -0.001 | 0.3899 | No | ||
| 12 | IL21 | 12241 | 10510 | -0.001 | 0.3804 | No | ||
| 13 | IL4 | 9174 | 11021 | -0.002 | 0.3545 | No | ||
| 14 | SFTPD | 21867 | 11707 | -0.004 | 0.3201 | No | ||
| 15 | IL18 | 9172 | 14115 | -0.012 | 0.1985 | No | ||
| 16 | CRTAM | 19160 | 14134 | -0.012 | 0.2054 | No | ||
| 17 | PTPRC | 5327 9662 | 15141 | -0.021 | 0.1655 | No | ||
| 18 | CADM1 | 7057 | 15651 | -0.032 | 0.1594 | No |