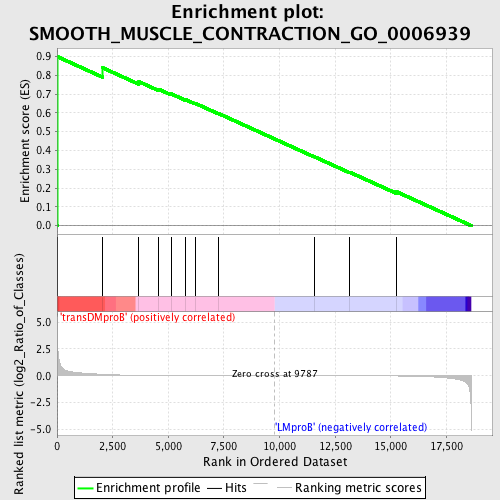
Profile of the Running ES Score & Positions of GeneSet Members on the Rank Ordered List
| Dataset | Set_04_transDMproB_versus_LMproB.phenotype_transDMproB_versus_LMproB.cls #transDMproB_versus_LMproB |
| Phenotype | phenotype_transDMproB_versus_LMproB.cls#transDMproB_versus_LMproB |
| Upregulated in class | transDMproB |
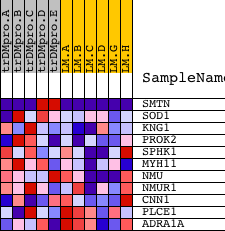
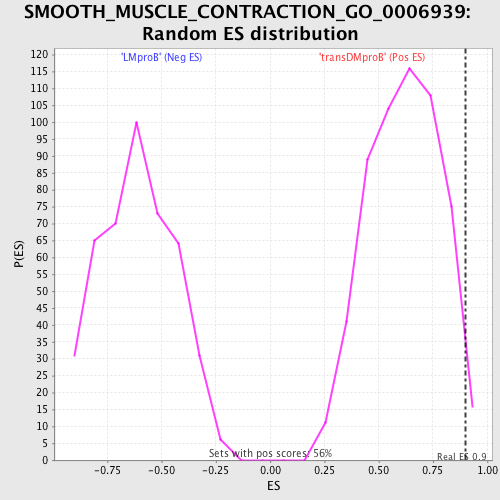
| GeneSet | SMOOTH_MUSCLE_CONTRACTION_GO_0006939 |
| Enrichment Score (ES) | 0.89841074 |
| Normalized Enrichment Score (NES) | 1.4591523 |
| Nominal p-value | 0.023214286 |
| FDR q-value | 1.0 |
| FWER p-Value | 1.0 |
| PROBE | DESCRIPTION (from dataset) | GENE SYMBOL | GENE_TITLE | RANK IN GENE LIST | RANK METRIC SCORE | RUNNING ES | CORE ENRICHMENT | |
|---|---|---|---|---|---|---|---|---|
| 1 | SMTN | 20551 1446 | 30 | 2.290 | 0.8984 | Yes | ||
| 2 | SOD1 | 9846 | 2048 | 0.128 | 0.8402 | No | ||
| 3 | KNG1 | 9244 22809 | 3673 | 0.034 | 0.7664 | No | ||
| 4 | PROK2 | 17057 | 4560 | 0.019 | 0.7263 | No | ||
| 5 | SPHK1 | 5484 1266 1402 | 5128 | 0.014 | 0.7014 | No | ||
| 6 | MYH11 | 22656 | 5763 | 0.011 | 0.6715 | No | ||
| 7 | NMU | 16506 | 6198 | 0.009 | 0.6516 | No | ||
| 8 | NMUR1 | 13898 | 7248 | 0.005 | 0.5973 | No | ||
| 9 | CNN1 | 8759 | 11547 | -0.003 | 0.3677 | No | ||
| 10 | PLCE1 | 13156 | 13158 | -0.008 | 0.2841 | No | ||
| 11 | ADRA1A | 2850 8560 | 15250 | -0.023 | 0.1809 | No |