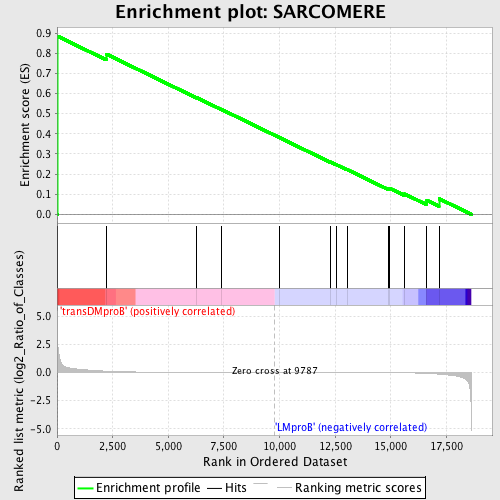
Profile of the Running ES Score & Positions of GeneSet Members on the Rank Ordered List
| Dataset | Set_04_transDMproB_versus_LMproB.phenotype_transDMproB_versus_LMproB.cls #transDMproB_versus_LMproB |
| Phenotype | phenotype_transDMproB_versus_LMproB.cls#transDMproB_versus_LMproB |
| Upregulated in class | transDMproB |
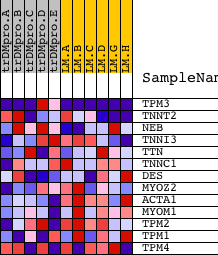
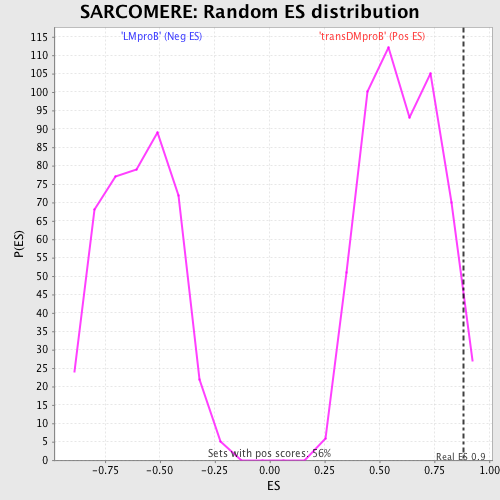
| GeneSet | SARCOMERE |
| Enrichment Score (ES) | 0.8850602 |
| Normalized Enrichment Score (NES) | 1.4541368 |
| Nominal p-value | 0.030141843 |
| FDR q-value | 1.0 |
| FWER p-Value | 1.0 |
| PROBE | DESCRIPTION (from dataset) | GENE SYMBOL | GENE_TITLE | RANK IN GENE LIST | RANK METRIC SCORE | RUNNING ES | CORE ENRICHMENT | |
|---|---|---|---|---|---|---|---|---|
| 1 | TPM3 | 12233 7209 7208 1790 | 12 | 3.461 | 0.8851 | Yes | ||
| 2 | TNNT2 | 14113 | 2210 | 0.113 | 0.7959 | No | ||
| 3 | NEB | 5158 | 6274 | 0.008 | 0.5796 | No | ||
| 4 | TNNI3 | 89 | 7403 | 0.005 | 0.5203 | No | ||
| 5 | TTN | 14552 2743 14553 | 9975 | -0.000 | 0.3822 | No | ||
| 6 | TNNC1 | 22058 | 12269 | -0.005 | 0.2602 | No | ||
| 7 | DES | 14215 | 12536 | -0.006 | 0.2474 | No | ||
| 8 | MYOZ2 | 15174 | 13035 | -0.007 | 0.2225 | No | ||
| 9 | ACTA1 | 18715 | 14894 | -0.018 | 0.1272 | No | ||
| 10 | MYOM1 | 23165 | 14945 | -0.019 | 0.1293 | No | ||
| 11 | TPM2 | 2367 2437 | 15616 | -0.031 | 0.1013 | No | ||
| 12 | TPM1 | 19070 | 16618 | -0.086 | 0.0694 | No | ||
| 13 | TPM4 | 11589 11588 6819 | 17167 | -0.148 | 0.0779 | No |