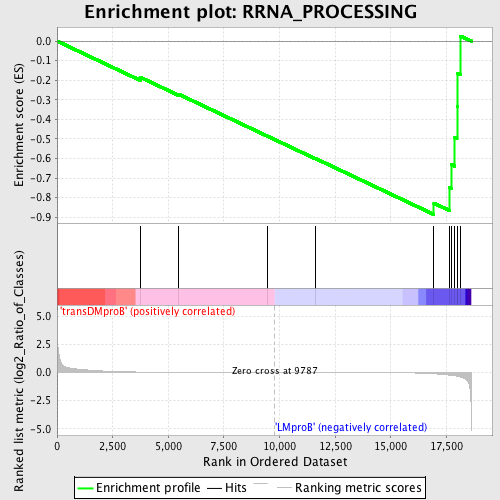
Profile of the Running ES Score & Positions of GeneSet Members on the Rank Ordered List
| Dataset | Set_04_transDMproB_versus_LMproB.phenotype_transDMproB_versus_LMproB.cls #transDMproB_versus_LMproB |
| Phenotype | phenotype_transDMproB_versus_LMproB.cls#transDMproB_versus_LMproB |
| Upregulated in class | LMproB |
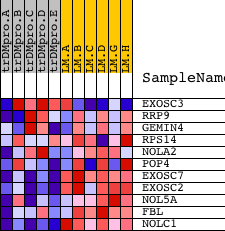
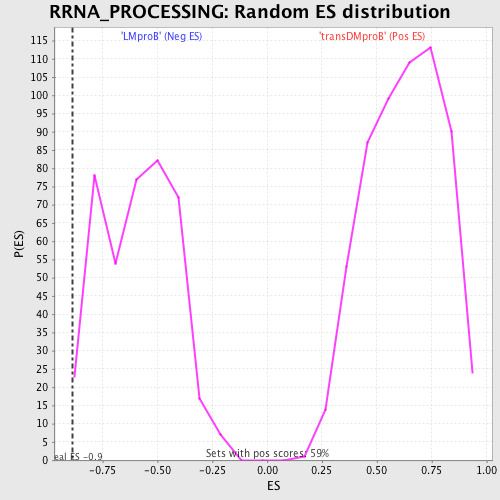
| GeneSet | RRNA_PROCESSING |
| Enrichment Score (ES) | -0.88584834 |
| Normalized Enrichment Score (NES) | -1.5012878 |
| Nominal p-value | 0.019512195 |
| FDR q-value | 1.0 |
| FWER p-Value | 1.0 |
| PROBE | DESCRIPTION (from dataset) | GENE SYMBOL | GENE_TITLE | RANK IN GENE LIST | RANK METRIC SCORE | RUNNING ES | CORE ENRICHMENT | |
|---|---|---|---|---|---|---|---|---|
| 1 | EXOSC3 | 15890 | 3748 | 0.033 | -0.1852 | No | ||
| 2 | RRP9 | 19328 | 5475 | 0.012 | -0.2720 | No | ||
| 3 | GEMIN4 | 6592 6591 | 9469 | 0.001 | -0.4863 | No | ||
| 4 | RPS14 | 9751 | 11615 | -0.004 | -0.5999 | No | ||
| 5 | NOLA2 | 11972 | 16937 | -0.117 | -0.8281 | Yes | ||
| 6 | POP4 | 7261 | 17650 | -0.236 | -0.7499 | Yes | ||
| 7 | EXOSC7 | 19256 | 17713 | -0.250 | -0.6302 | Yes | ||
| 8 | EXOSC2 | 15044 | 17879 | -0.297 | -0.4926 | Yes | ||
| 9 | NOL5A | 12474 | 17975 | -0.331 | -0.3346 | Yes | ||
| 10 | FBL | 8955 | 18011 | -0.345 | -0.1662 | Yes | ||
| 11 | NOLC1 | 7704 | 18142 | -0.403 | 0.0255 | Yes |