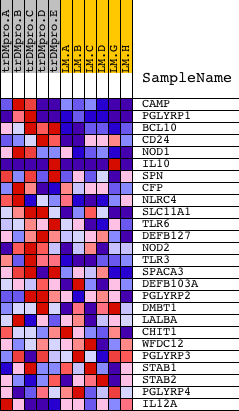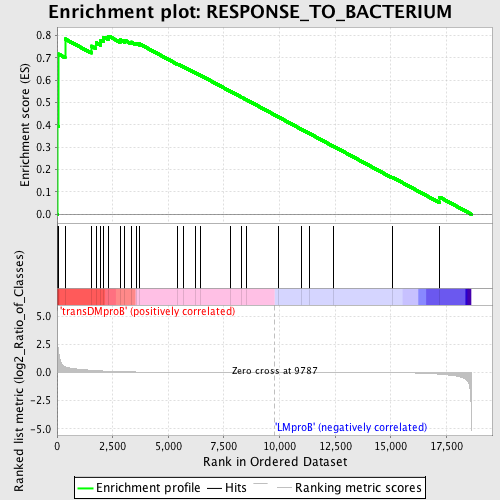
Profile of the Running ES Score & Positions of GeneSet Members on the Rank Ordered List
| Dataset | Set_04_transDMproB_versus_LMproB.phenotype_transDMproB_versus_LMproB.cls #transDMproB_versus_LMproB |
| Phenotype | phenotype_transDMproB_versus_LMproB.cls#transDMproB_versus_LMproB |
| Upregulated in class | transDMproB |
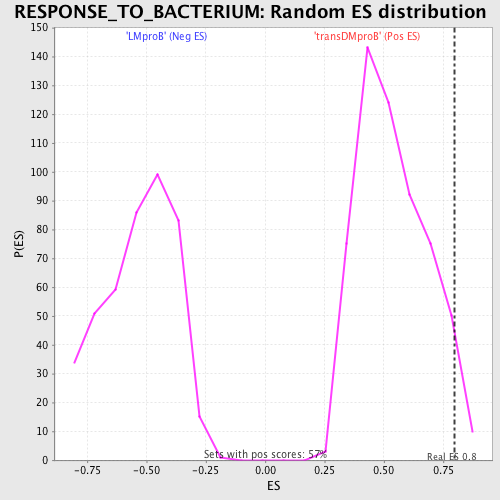
| GeneSet | RESPONSE_TO_BACTERIUM |
| Enrichment Score (ES) | 0.79800266 |
| Normalized Enrichment Score (NES) | 1.4795481 |
| Nominal p-value | 0.033216782 |
| FDR q-value | 1.0 |
| FWER p-Value | 1.0 |
| PROBE | DESCRIPTION (from dataset) | GENE SYMBOL | GENE_TITLE | RANK IN GENE LIST | RANK METRIC SCORE | RUNNING ES | CORE ENRICHMENT | |
|---|---|---|---|---|---|---|---|---|
| 1 | CAMP | 18990 | 22 | 2.405 | 0.3939 | Yes | ||
| 2 | PGLYRP1 | 18369 | 51 | 1.982 | 0.7180 | Yes | ||
| 3 | BCL10 | 15397 | 358 | 0.510 | 0.7854 | Yes | ||
| 4 | CD24 | 8711 | 1532 | 0.192 | 0.7537 | Yes | ||
| 5 | NOD1 | 17141 | 1747 | 0.164 | 0.7691 | Yes | ||
| 6 | IL10 | 14145 1510 1553 22902 | 1962 | 0.138 | 0.7802 | Yes | ||
| 7 | SPN | 452 5493 | 2087 | 0.123 | 0.7936 | Yes | ||
| 8 | CFP | 24174 | 2317 | 0.102 | 0.7980 | Yes | ||
| 9 | NLRC4 | 11225 | 2832 | 0.067 | 0.7813 | No | ||
| 10 | SLC11A1 | 5189 9483 5190 | 3044 | 0.056 | 0.7792 | No | ||
| 11 | TLR6 | 215 16528 | 3323 | 0.045 | 0.7717 | No | ||
| 12 | DEFB127 | 622 | 3561 | 0.038 | 0.7651 | No | ||
| 13 | NOD2 | 6384 | 3697 | 0.034 | 0.7634 | No | ||
| 14 | TLR3 | 18884 | 5432 | 0.012 | 0.6722 | No | ||
| 15 | SPACA3 | 13680 | 5693 | 0.011 | 0.6600 | No | ||
| 16 | DEFB103A | 18665 | 6213 | 0.009 | 0.6335 | No | ||
| 17 | PGLYRP2 | 7174 | 6422 | 0.008 | 0.6236 | No | ||
| 18 | DMBT1 | 18050 | 7783 | 0.004 | 0.5511 | No | ||
| 19 | LALBA | 22141 | 8306 | 0.003 | 0.5235 | No | ||
| 20 | CHIT1 | 14132 | 8496 | 0.002 | 0.5137 | No | ||
| 21 | WFDC12 | 14356 | 9967 | -0.000 | 0.4347 | No | ||
| 22 | PGLYRP3 | 10812 | 10968 | -0.002 | 0.3813 | No | ||
| 23 | STAB1 | 21892 | 11341 | -0.003 | 0.3617 | No | ||
| 24 | STAB2 | 19656 | 12436 | -0.005 | 0.3038 | No | ||
| 25 | PGLYRP4 | 11810 | 15060 | -0.020 | 0.1660 | No | ||
| 26 | IL12A | 4913 | 17196 | -0.153 | 0.0764 | No |