Profile of the Running ES Score & Positions of GeneSet Members on the Rank Ordered List
| Dataset | Set_04_transDMproB_versus_LMproB.phenotype_transDMproB_versus_LMproB.cls #transDMproB_versus_LMproB |
| Phenotype | phenotype_transDMproB_versus_LMproB.cls#transDMproB_versus_LMproB |
| Upregulated in class | transDMproB |
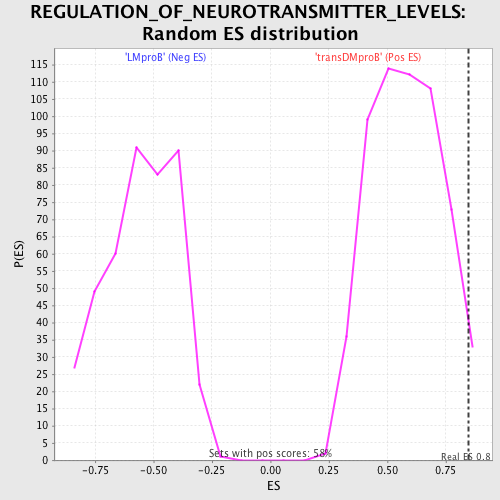
| GeneSet | REGULATION_OF_NEUROTRANSMITTER_LEVELS |
| Enrichment Score (ES) | 0.84774244 |
| Normalized Enrichment Score (NES) | 1.4592743 |
| Nominal p-value | 0.024263432 |
| FDR q-value | 1.0 |
| FWER p-Value | 1.0 |
| PROBE | DESCRIPTION (from dataset) | GENE SYMBOL | GENE_TITLE | RANK IN GENE LIST | RANK METRIC SCORE | RUNNING ES | CORE ENRICHMENT | |
|---|---|---|---|---|---|---|---|---|
| 1 | PRG3 | 14971 | 143 | 1.107 | 0.5177 | Yes | ||
| 2 | GCH1 | 9008 4762 | 430 | 0.454 | 0.7176 | Yes | ||
| 3 | RAB3A | 9681 | 801 | 0.316 | 0.8477 | Yes | ||
| 4 | HPRT1 | 2655 24339 408 | 3353 | 0.044 | 0.7314 | No | ||
| 5 | SLC1A3 | 22331 | 3898 | 0.029 | 0.7162 | No | ||
| 6 | HRH3 | 14317 | 4980 | 0.015 | 0.6653 | No | ||
| 7 | SEPT5 | 9598 | 5049 | 0.015 | 0.6686 | No | ||
| 8 | RIMS1 | 8575 | 7054 | 0.006 | 0.5637 | No | ||
| 9 | SYT1 | 5565 | 7779 | 0.004 | 0.5266 | No | ||
| 10 | GDNF | 22514 2275 | 7813 | 0.004 | 0.5267 | No | ||
| 11 | SNCAIP | 12589 | 8013 | 0.003 | 0.5176 | No | ||
| 12 | SLC5A7 | 22938 | 8124 | 0.003 | 0.5132 | No | ||
| 13 | SLC6A4 | 20770 | 8766 | 0.002 | 0.4797 | No | ||
| 14 | NLGN1 | 15368 | 11040 | -0.002 | 0.3585 | No | ||
| 15 | ALDH9A1 | 14064 | 11380 | -0.003 | 0.3418 | No | ||
| 16 | SYN3 | 19658 | 12847 | -0.007 | 0.2661 | No | ||
| 17 | GRM4 | 332 | 13633 | -0.009 | 0.2284 | No | ||
| 18 | TGFB2 | 5743 | 13681 | -0.010 | 0.2305 | No | ||
| 19 | CARTPT | 21374 | 15506 | -0.028 | 0.1458 | No | ||
| 20 | KCNMB4 | 12217 | 15990 | -0.045 | 0.1412 | No |