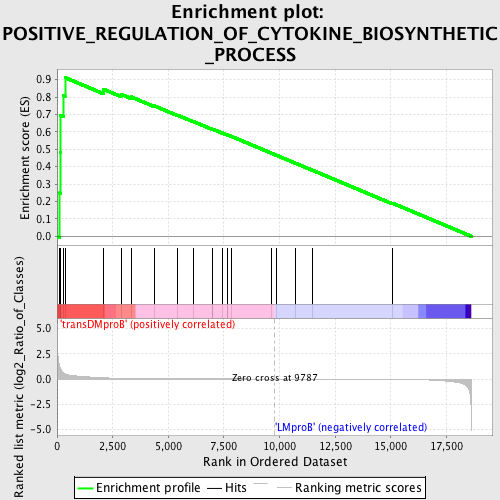
Profile of the Running ES Score & Positions of GeneSet Members on the Rank Ordered List
| Dataset | Set_04_transDMproB_versus_LMproB.phenotype_transDMproB_versus_LMproB.cls #transDMproB_versus_LMproB |
| Phenotype | phenotype_transDMproB_versus_LMproB.cls#transDMproB_versus_LMproB |
| Upregulated in class | transDMproB |
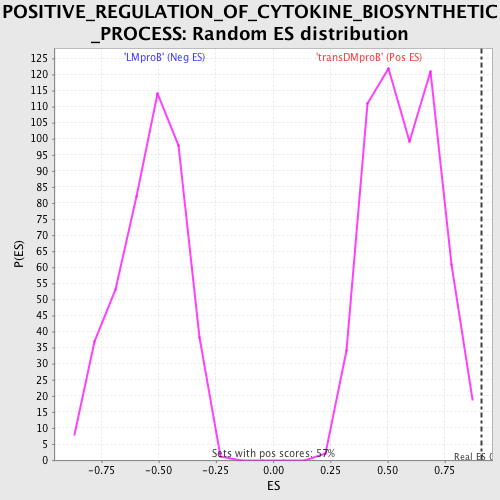
| GeneSet | POSITIVE_REGULATION_OF_CYTOKINE_BIOSYNTHETIC_PROCESS |
| Enrichment Score (ES) | 0.9118677 |
| Normalized Enrichment Score (NES) | 1.6011881 |
| Nominal p-value | 0.0017574693 |
| FDR q-value | 1.0 |
| FWER p-Value | 0.631 |
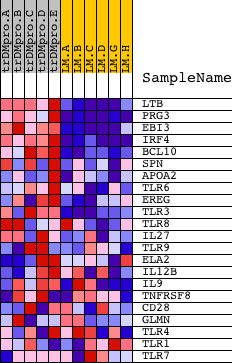
| PROBE | DESCRIPTION (from dataset) | GENE SYMBOL | GENE_TITLE | RANK IN GENE LIST | RANK METRIC SCORE | RUNNING ES | CORE ENRICHMENT | |
|---|---|---|---|---|---|---|---|---|
| 1 | LTB | 23259 | 124 | 1.219 | 0.2489 | Yes | ||
| 2 | PRG3 | 14971 | 143 | 1.107 | 0.4801 | Yes | ||
| 3 | EBI3 | 23193 | 152 | 1.034 | 0.6964 | Yes | ||
| 4 | IRF4 | 21679 | 298 | 0.570 | 0.8081 | Yes | ||
| 5 | BCL10 | 15397 | 358 | 0.510 | 0.9119 | Yes | ||
| 6 | SPN | 452 5493 | 2087 | 0.123 | 0.8446 | No | ||
| 7 | APOA2 | 8615 4044 | 2884 | 0.064 | 0.8153 | No | ||
| 8 | TLR6 | 215 16528 | 3323 | 0.045 | 0.8012 | No | ||
| 9 | EREG | 4679 16797 | 4368 | 0.021 | 0.7495 | No | ||
| 10 | TLR3 | 18884 | 5432 | 0.012 | 0.6949 | No | ||
| 11 | TLR8 | 9308 | 6124 | 0.009 | 0.6596 | No | ||
| 12 | IL27 | 17636 | 6962 | 0.006 | 0.6159 | No | ||
| 13 | TLR9 | 19331 3127 | 6983 | 0.006 | 0.6161 | No | ||
| 14 | ELA2 | 11925 8893 | 7417 | 0.005 | 0.5938 | No | ||
| 15 | IL12B | 20918 | 7650 | 0.004 | 0.5823 | No | ||
| 16 | IL9 | 21444 | 7663 | 0.004 | 0.5825 | No | ||
| 17 | TNFRSF8 | 2373 5784 | 7820 | 0.004 | 0.5749 | No | ||
| 18 | CD28 | 14239 4092 | 9636 | 0.000 | 0.4774 | No | ||
| 19 | GLMN | 16452 3562 | 9854 | -0.000 | 0.4658 | No | ||
| 20 | TLR4 | 2329 10191 5770 | 10692 | -0.002 | 0.4211 | No | ||
| 21 | TLR1 | 10190 | 11457 | -0.003 | 0.3807 | No | ||
| 22 | TLR7 | 24004 | 15063 | -0.020 | 0.1911 | No |