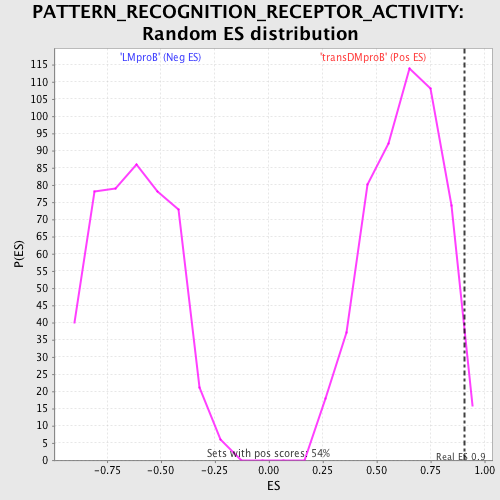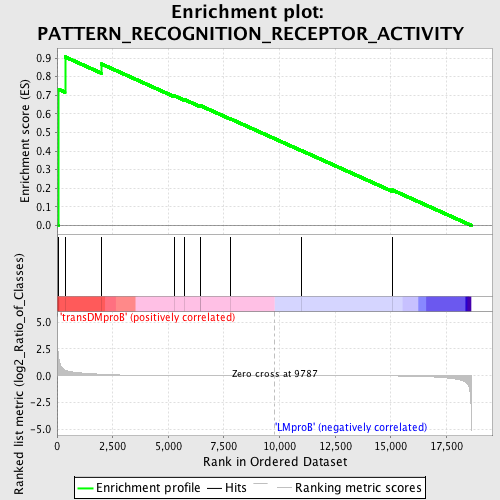
Profile of the Running ES Score & Positions of GeneSet Members on the Rank Ordered List
| Dataset | Set_04_transDMproB_versus_LMproB.phenotype_transDMproB_versus_LMproB.cls #transDMproB_versus_LMproB |
| Phenotype | phenotype_transDMproB_versus_LMproB.cls#transDMproB_versus_LMproB |
| Upregulated in class | transDMproB |
| GeneSet | PATTERN_RECOGNITION_RECEPTOR_ACTIVITY |
| Enrichment Score (ES) | 0.90675795 |
| Normalized Enrichment Score (NES) | 1.4461579 |
| Nominal p-value | 0.020408163 |
| FDR q-value | 1.0 |
| FWER p-Value | 1.0 |
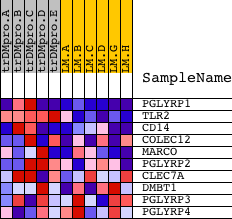
| PROBE | DESCRIPTION (from dataset) | GENE SYMBOL | GENE_TITLE | RANK IN GENE LIST | RANK METRIC SCORE | RUNNING ES | CORE ENRICHMENT | |
|---|---|---|---|---|---|---|---|---|
| 1 | PGLYRP1 | 18369 | 51 | 1.982 | 0.7328 | Yes | ||
| 2 | TLR2 | 15308 | 355 | 0.513 | 0.9068 | Yes | ||
| 3 | CD14 | 23452 | 1988 | 0.134 | 0.8687 | No | ||
| 4 | COLEC12 | 23624 8946 | 5281 | 0.013 | 0.6967 | No | ||
| 5 | MARCO | 13852 | 5733 | 0.011 | 0.6765 | No | ||
| 6 | PGLYRP2 | 7174 | 6422 | 0.008 | 0.6424 | No | ||
| 7 | CLEC7A | 7142 16977 12157 1111 | 6444 | 0.008 | 0.6442 | No | ||
| 8 | DMBT1 | 18050 | 7783 | 0.004 | 0.5737 | No | ||
| 9 | PGLYRP3 | 10812 | 10968 | -0.002 | 0.4034 | No | ||
| 10 | PGLYRP4 | 11810 | 15060 | -0.020 | 0.1911 | No |