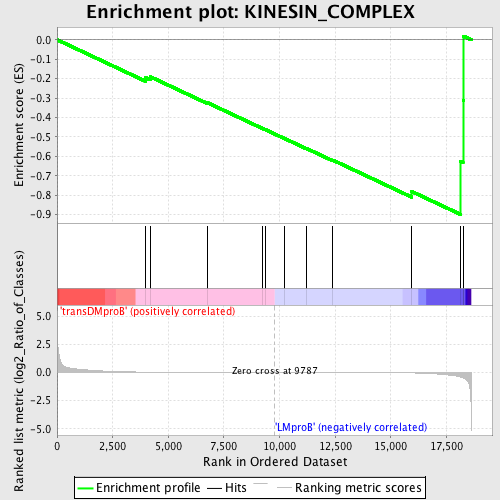
Profile of the Running ES Score & Positions of GeneSet Members on the Rank Ordered List
| Dataset | Set_04_transDMproB_versus_LMproB.phenotype_transDMproB_versus_LMproB.cls #transDMproB_versus_LMproB |
| Phenotype | phenotype_transDMproB_versus_LMproB.cls#transDMproB_versus_LMproB |
| Upregulated in class | LMproB |
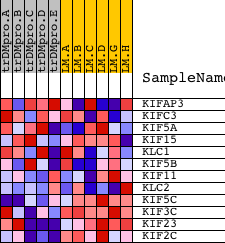
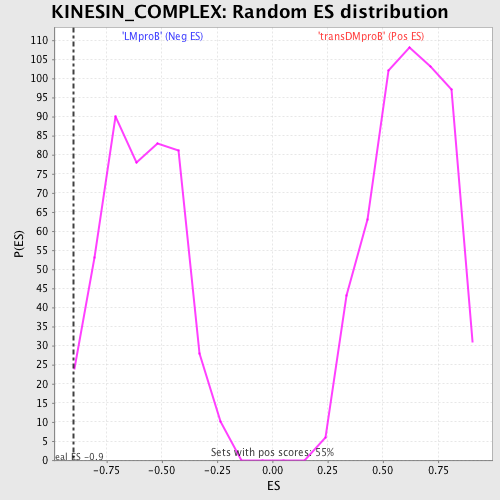
| GeneSet | KINESIN_COMPLEX |
| Enrichment Score (ES) | -0.8987986 |
| Normalized Enrichment Score (NES) | -1.5176947 |
| Nominal p-value | 0.013422819 |
| FDR q-value | 1.0 |
| FWER p-Value | 0.999 |
| PROBE | DESCRIPTION (from dataset) | GENE SYMBOL | GENE_TITLE | RANK IN GENE LIST | RANK METRIC SCORE | RUNNING ES | CORE ENRICHMENT | |
|---|---|---|---|---|---|---|---|---|
| 1 | KIFAP3 | 3962 14078 9224 | 3982 | 0.027 | -0.1954 | No | ||
| 2 | KIFC3 | 9227 | 4197 | 0.024 | -0.1907 | No | ||
| 3 | KIF5A | 9222 | 6777 | 0.007 | -0.3248 | No | ||
| 4 | KIF15 | 9955 5563 19257 | 9213 | 0.001 | -0.4550 | No | ||
| 5 | KLC1 | 4959 369 2156 384 | 9344 | 0.001 | -0.4614 | No | ||
| 6 | KIF5B | 4955 2031 | 10215 | -0.001 | -0.5076 | No | ||
| 7 | KIF11 | 23873 | 11189 | -0.003 | -0.5581 | No | ||
| 8 | KLC2 | 23973 3701 | 12384 | -0.005 | -0.6186 | No | ||
| 9 | KIF5C | 15014 | 15936 | -0.043 | -0.7804 | Yes | ||
| 10 | KIF3C | 9220 4954 | 18139 | -0.402 | -0.6264 | Yes | ||
| 11 | KIF23 | 19091 | 18248 | -0.473 | -0.3118 | Yes | ||
| 12 | KIF2C | 15789 | 18269 | -0.489 | 0.0187 | Yes |