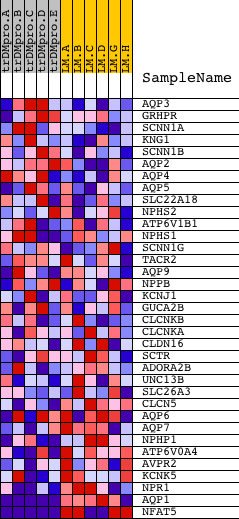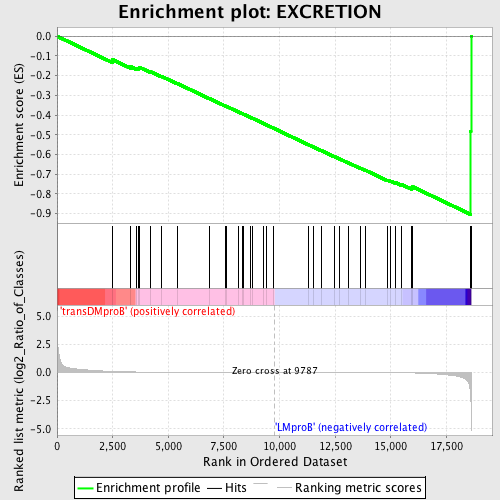
Profile of the Running ES Score & Positions of GeneSet Members on the Rank Ordered List
| Dataset | Set_04_transDMproB_versus_LMproB.phenotype_transDMproB_versus_LMproB.cls #transDMproB_versus_LMproB |
| Phenotype | phenotype_transDMproB_versus_LMproB.cls#transDMproB_versus_LMproB |
| Upregulated in class | LMproB |
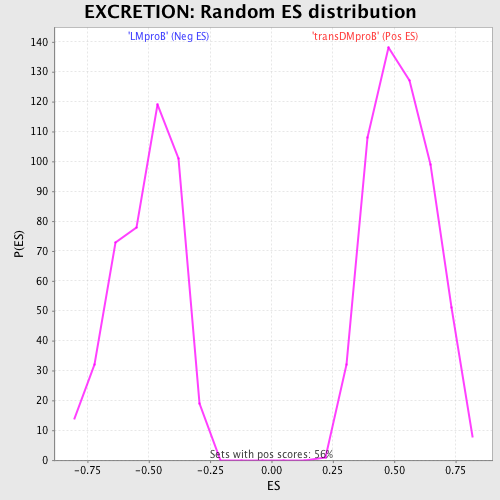
| GeneSet | EXCRETION |
| Enrichment Score (ES) | -0.90424246 |
| Normalized Enrichment Score (NES) | -1.7796783 |
| Nominal p-value | 0.0 |
| FDR q-value | 0.02121325 |
| FWER p-Value | 0.022 |
| PROBE | DESCRIPTION (from dataset) | GENE SYMBOL | GENE_TITLE | RANK IN GENE LIST | RANK METRIC SCORE | RUNNING ES | CORE ENRICHMENT | |
|---|---|---|---|---|---|---|---|---|
| 1 | AQP3 | 15915 | 2487 | 0.089 | -0.1185 | No | ||
| 2 | GRHPR | 16224 | 3295 | 0.046 | -0.1540 | No | ||
| 3 | SCNN1A | 17278 | 3577 | 0.037 | -0.1627 | No | ||
| 4 | KNG1 | 9244 22809 | 3673 | 0.034 | -0.1619 | No | ||
| 5 | SCNN1B | 18094 | 3693 | 0.034 | -0.1571 | No | ||
| 6 | AQP2 | 22366 | 4205 | 0.024 | -0.1805 | No | ||
| 7 | AQP4 | 4403 | 4674 | 0.018 | -0.2025 | No | ||
| 8 | AQP5 | 22365 | 5407 | 0.013 | -0.2398 | No | ||
| 9 | SLC22A18 | 18000 | 6839 | 0.007 | -0.3156 | No | ||
| 10 | NPHS2 | 4111 9292 5013 14088 | 7589 | 0.004 | -0.3552 | No | ||
| 11 | ATP6V1B1 | 8499 | 7594 | 0.004 | -0.3546 | No | ||
| 12 | NPHS1 | 12048 | 8166 | 0.003 | -0.3848 | No | ||
| 13 | SCNN1G | 18095 | 8337 | 0.003 | -0.3935 | No | ||
| 14 | TACR2 | 20004 | 8378 | 0.003 | -0.3952 | No | ||
| 15 | AQP9 | 7218 | 8698 | 0.002 | -0.4120 | No | ||
| 16 | NPPB | 15994 | 8790 | 0.002 | -0.4166 | No | ||
| 17 | KCNJ1 | 3121 12110 | 9274 | 0.001 | -0.4424 | No | ||
| 18 | GUCA2B | 15773 | 9409 | 0.001 | -0.4495 | No | ||
| 19 | CLCNKB | 7105 | 9730 | 0.000 | -0.4667 | No | ||
| 20 | CLCNKA | 15690 | 11299 | -0.003 | -0.5506 | No | ||
| 21 | CLDN16 | 22802 | 11531 | -0.003 | -0.5624 | No | ||
| 22 | SCTR | 14157 | 11886 | -0.004 | -0.5808 | No | ||
| 23 | ADORA2B | 20850 | 12446 | -0.005 | -0.6099 | No | ||
| 24 | UNC13B | 10255 | 12714 | -0.006 | -0.6232 | No | ||
| 25 | SLC26A3 | 21298 | 13082 | -0.007 | -0.6417 | No | ||
| 26 | CLCN5 | 24204 | 13658 | -0.010 | -0.6710 | No | ||
| 27 | AQP6 | 22364 8621 | 13872 | -0.011 | -0.6806 | No | ||
| 28 | AQP7 | 15916 8622 4404 | 14869 | -0.018 | -0.7311 | No | ||
| 29 | NPHP1 | 2773 14435 | 15006 | -0.020 | -0.7351 | No | ||
| 30 | ATP6V0A4 | 8934 | 15200 | -0.022 | -0.7416 | No | ||
| 31 | AVPR2 | 8646 | 15466 | -0.027 | -0.7511 | No | ||
| 32 | KCNK5 | 4946 9212 | 15944 | -0.043 | -0.7694 | Yes | ||
| 33 | NPR1 | 9480 | 15974 | -0.044 | -0.7633 | Yes | ||
| 34 | AQP1 | 1057 17437 | 18594 | -2.442 | -0.4831 | Yes | ||
| 35 | NFAT5 | 3921 7037 12036 | 18604 | -2.808 | 0.0006 | Yes |