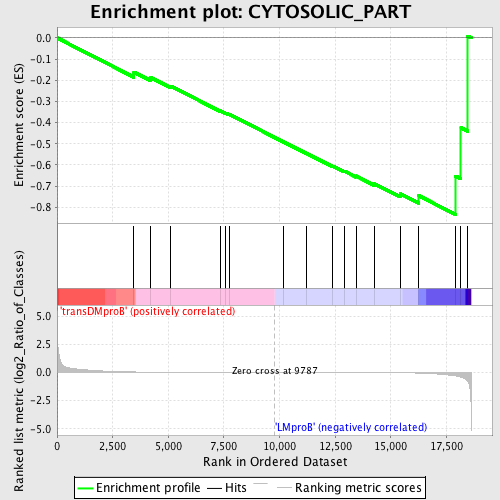
Profile of the Running ES Score & Positions of GeneSet Members on the Rank Ordered List
| Dataset | Set_04_transDMproB_versus_LMproB.phenotype_transDMproB_versus_LMproB.cls #transDMproB_versus_LMproB |
| Phenotype | phenotype_transDMproB_versus_LMproB.cls#transDMproB_versus_LMproB |
| Upregulated in class | LMproB |
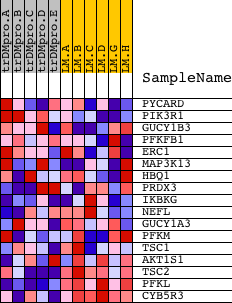
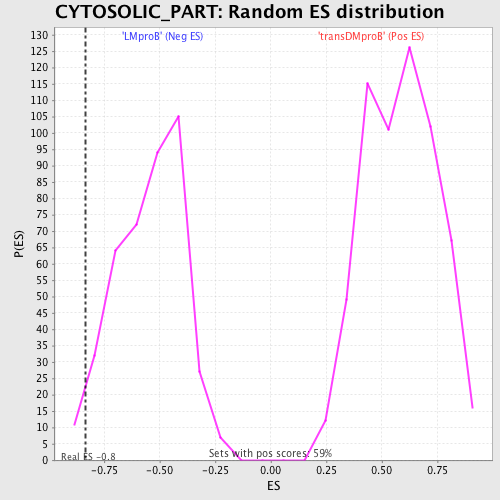
| GeneSet | CYTOSOLIC_PART |
| Enrichment Score (ES) | -0.8343751 |
| Normalized Enrichment Score (NES) | -1.5301932 |
| Nominal p-value | 0.026699029 |
| FDR q-value | 1.0 |
| FWER p-Value | 0.999 |
| PROBE | DESCRIPTION (from dataset) | GENE SYMBOL | GENE_TITLE | RANK IN GENE LIST | RANK METRIC SCORE | RUNNING ES | CORE ENRICHMENT | |
|---|---|---|---|---|---|---|---|---|
| 1 | PYCARD | 7341 | 3450 | 0.041 | -0.1613 | No | ||
| 2 | PIK3R1 | 3170 | 4187 | 0.024 | -0.1866 | No | ||
| 3 | GUCY1B3 | 15311 | 5115 | 0.014 | -0.2280 | No | ||
| 4 | PFKFB1 | 9552 | 7348 | 0.005 | -0.3450 | No | ||
| 5 | ERC1 | 1013 17021 995 1136 | 7588 | 0.004 | -0.3552 | No | ||
| 6 | MAP3K13 | 22814 | 7749 | 0.004 | -0.3614 | No | ||
| 7 | HBQ1 | 20928 | 10187 | -0.001 | -0.4919 | No | ||
| 8 | PRDX3 | 23632 | 11216 | -0.003 | -0.5456 | No | ||
| 9 | IKBKG | 2570 2562 4908 | 12392 | -0.005 | -0.6056 | No | ||
| 10 | NEFL | 9459 | 12909 | -0.007 | -0.6293 | No | ||
| 11 | GUCY1A3 | 7216 12245 15310 | 13434 | -0.009 | -0.6524 | No | ||
| 12 | PFKM | 5243 9554 | 14275 | -0.013 | -0.6899 | No | ||
| 13 | TSC1 | 7235 | 15423 | -0.027 | -0.7358 | No | ||
| 14 | AKT1S1 | 12557 | 16258 | -0.059 | -0.7458 | Yes | ||
| 15 | TSC2 | 23090 | 17906 | -0.307 | -0.6528 | Yes | ||
| 16 | PFKL | 9553 | 18153 | -0.407 | -0.4250 | Yes | ||
| 17 | CYB5R3 | 2313 22186 | 18458 | -0.760 | 0.0085 | Yes |