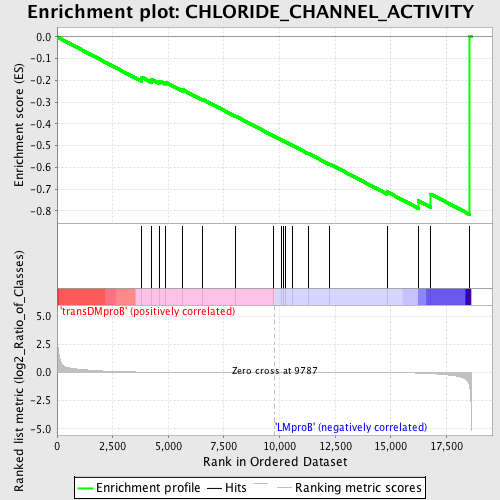
Profile of the Running ES Score & Positions of GeneSet Members on the Rank Ordered List
| Dataset | Set_04_transDMproB_versus_LMproB.phenotype_transDMproB_versus_LMproB.cls #transDMproB_versus_LMproB |
| Phenotype | phenotype_transDMproB_versus_LMproB.cls#transDMproB_versus_LMproB |
| Upregulated in class | LMproB |
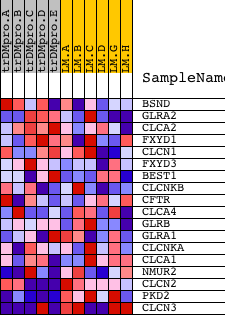
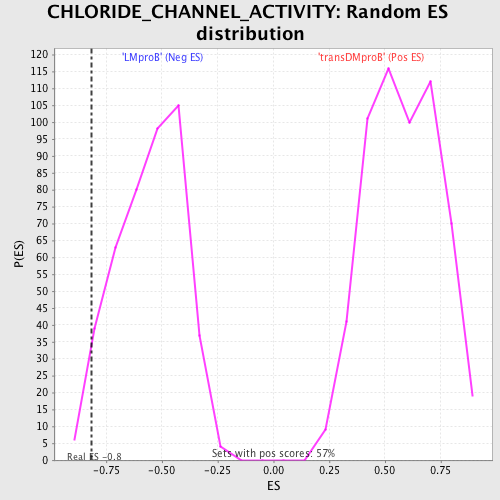
| GeneSet | CHLORIDE_CHANNEL_ACTIVITY |
| Enrichment Score (ES) | -0.81672645 |
| Normalized Enrichment Score (NES) | -1.4785055 |
| Nominal p-value | 0.032407407 |
| FDR q-value | 1.0 |
| FWER p-Value | 1.0 |
| PROBE | DESCRIPTION (from dataset) | GENE SYMBOL | GENE_TITLE | RANK IN GENE LIST | RANK METRIC SCORE | RUNNING ES | CORE ENRICHMENT | |
|---|---|---|---|---|---|---|---|---|
| 1 | BSND | 15821 | 3809 | 0.032 | -0.1858 | No | ||
| 2 | GLRA2 | 24008 | 4241 | 0.023 | -0.1952 | No | ||
| 3 | CLCA2 | 15148 | 4611 | 0.019 | -0.2038 | No | ||
| 4 | FXYD1 | 17874 85 | 4888 | 0.016 | -0.2091 | No | ||
| 5 | CLCN1 | 8744 | 5648 | 0.011 | -0.2432 | No | ||
| 6 | FXYD3 | 9370 | 6554 | 0.007 | -0.2874 | No | ||
| 7 | BEST1 | 23747 | 8024 | 0.003 | -0.3644 | No | ||
| 8 | CLCNKB | 7105 | 9730 | 0.000 | -0.4560 | No | ||
| 9 | CFTR | 17518 | 10072 | -0.001 | -0.4740 | No | ||
| 10 | CLCA4 | 6041 | 10178 | -0.001 | -0.4792 | No | ||
| 11 | GLRB | 15312 1846 | 10280 | -0.001 | -0.4840 | No | ||
| 12 | GLRA1 | 9021 | 10565 | -0.001 | -0.4984 | No | ||
| 13 | CLCNKA | 15690 | 11299 | -0.003 | -0.5361 | No | ||
| 14 | CLCA1 | 15149 | 12256 | -0.005 | -0.5845 | No | ||
| 15 | NMUR2 | 20443 | 14828 | -0.017 | -0.7124 | No | ||
| 16 | CLCN2 | 22637 | 16235 | -0.058 | -0.7536 | Yes | ||
| 17 | PKD2 | 16772 | 16797 | -0.102 | -0.7227 | Yes | ||
| 18 | CLCN3 | 8745 3782 3893 4524 | 18547 | -1.374 | 0.0037 | Yes |