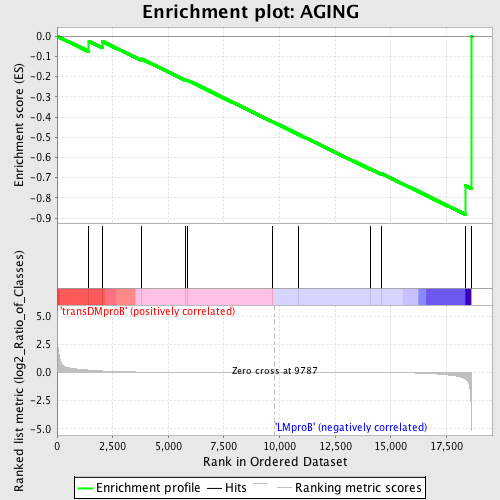
Profile of the Running ES Score & Positions of GeneSet Members on the Rank Ordered List
| Dataset | Set_04_transDMproB_versus_LMproB.phenotype_transDMproB_versus_LMproB.cls #transDMproB_versus_LMproB |
| Phenotype | phenotype_transDMproB_versus_LMproB.cls#transDMproB_versus_LMproB |
| Upregulated in class | LMproB |
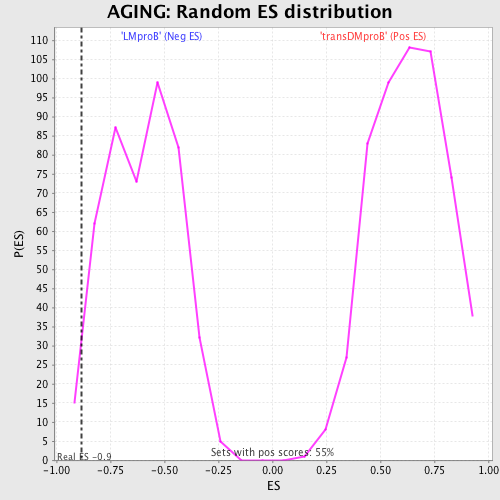
| GeneSet | AGING |
| Enrichment Score (ES) | -0.88185483 |
| Normalized Enrichment Score (NES) | -1.4710715 |
| Nominal p-value | 0.021978023 |
| FDR q-value | 0.95408547 |
| FWER p-Value | 1.0 |
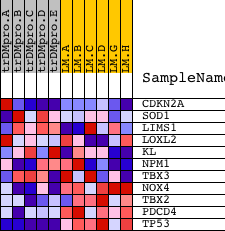
| PROBE | DESCRIPTION (from dataset) | GENE SYMBOL | GENE_TITLE | RANK IN GENE LIST | RANK METRIC SCORE | RUNNING ES | CORE ENRICHMENT | |
|---|---|---|---|---|---|---|---|---|
| 1 | CDKN2A | 2491 15841 | 1432 | 0.207 | -0.0253 | No | ||
| 2 | SOD1 | 9846 | 2048 | 0.128 | -0.0265 | No | ||
| 3 | LIMS1 | 8493 4290 | 3802 | 0.032 | -0.1128 | No | ||
| 4 | LOXL2 | 8256 | 5768 | 0.011 | -0.2157 | No | ||
| 5 | KL | 16611 | 5869 | 0.010 | -0.2186 | No | ||
| 6 | NPM1 | 1196 | 9669 | 0.000 | -0.4227 | No | ||
| 7 | TBX3 | 16723 | 10866 | -0.002 | -0.4865 | No | ||
| 8 | NOX4 | 18196 | 14088 | -0.012 | -0.6567 | No | ||
| 9 | TBX2 | 20720 | 14564 | -0.015 | -0.6785 | No | ||
| 10 | PDCD4 | 5232 23816 | 18348 | -0.571 | -0.7393 | Yes | ||
| 11 | TP53 | 20822 | 18610 | -3.019 | 0.0003 | Yes |