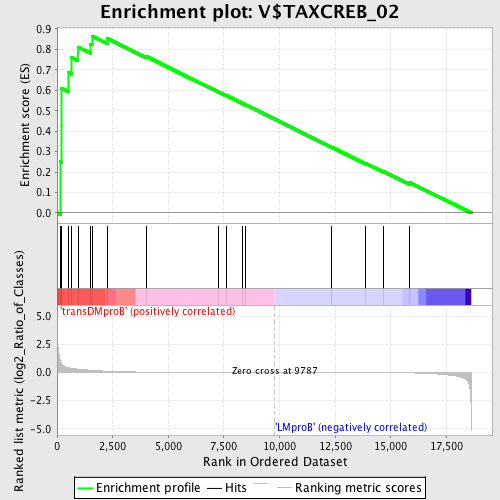
Profile of the Running ES Score & Positions of GeneSet Members on the Rank Ordered List
| Dataset | Set_04_transDMproB_versus_LMproB.phenotype_transDMproB_versus_LMproB.cls #transDMproB_versus_LMproB |
| Phenotype | phenotype_transDMproB_versus_LMproB.cls#transDMproB_versus_LMproB |
| Upregulated in class | transDMproB |
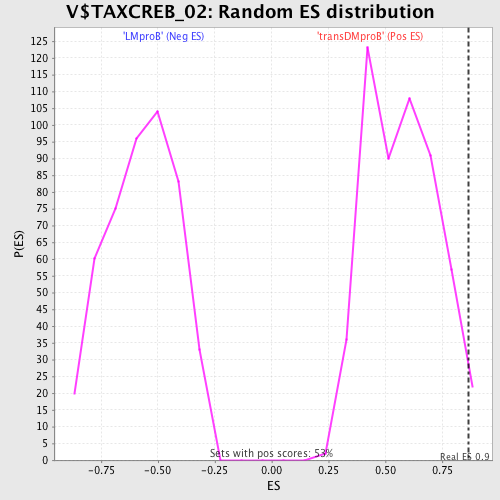
| GeneSet | V$TAXCREB_02 |
| Enrichment Score (ES) | 0.8648603 |
| Normalized Enrichment Score (NES) | 1.5080034 |
| Nominal p-value | 0.017013233 |
| FDR q-value | 0.41549036 |
| FWER p-Value | 0.952 |
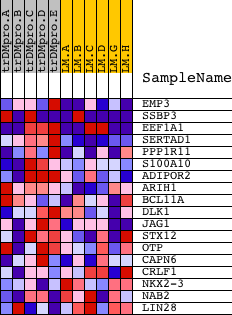
| PROBE | DESCRIPTION (from dataset) | GENE SYMBOL | GENE_TITLE | RANK IN GENE LIST | RANK METRIC SCORE | RUNNING ES | CORE ENRICHMENT | |
|---|---|---|---|---|---|---|---|---|
| 1 | EMP3 | 17824 968 | 139 | 1.126 | 0.2511 | Yes | ||
| 2 | SSBP3 | 2439 7814 2431 | 198 | 0.788 | 0.4290 | Yes | ||
| 3 | EEF1A1 | 38 38 8879 | 199 | 0.787 | 0.6098 | Yes | ||
| 4 | SERTAD1 | 18326 | 511 | 0.407 | 0.6865 | Yes | ||
| 5 | PPP1R11 | 8025 | 658 | 0.354 | 0.7600 | Yes | ||
| 6 | S100A10 | 15518 | 938 | 0.290 | 0.8115 | Yes | ||
| 7 | ADIPOR2 | 17024 | 1501 | 0.196 | 0.8262 | Yes | ||
| 8 | ARIH1 | 6210 | 1572 | 0.185 | 0.8649 | Yes | ||
| 9 | BCL11A | 4691 | 2248 | 0.109 | 0.8536 | No | ||
| 10 | DLK1 | 4632 | 4001 | 0.027 | 0.7657 | No | ||
| 11 | JAG1 | 14415 | 7246 | 0.005 | 0.5925 | No | ||
| 12 | STX12 | 4140 | 7628 | 0.004 | 0.5730 | No | ||
| 13 | OTP | 21582 | 8333 | 0.003 | 0.5358 | No | ||
| 14 | CAPN6 | 24041 | 8487 | 0.002 | 0.5281 | No | ||
| 15 | CRLF1 | 18588 | 12336 | -0.005 | 0.3224 | No | ||
| 16 | NKX2-3 | 5177 23845 | 13883 | -0.011 | 0.2417 | No | ||
| 17 | NAB2 | 5146 | 14683 | -0.016 | 0.2024 | No | ||
| 18 | LIN28 | 15723 | 15852 | -0.039 | 0.1486 | No |