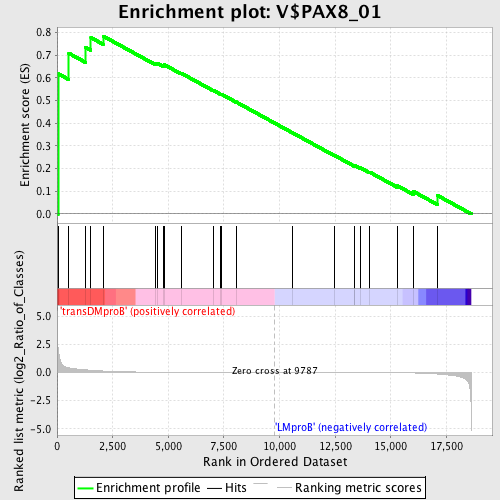
Profile of the Running ES Score & Positions of GeneSet Members on the Rank Ordered List
| Dataset | Set_04_transDMproB_versus_LMproB.phenotype_transDMproB_versus_LMproB.cls #transDMproB_versus_LMproB |
| Phenotype | phenotype_transDMproB_versus_LMproB.cls#transDMproB_versus_LMproB |
| Upregulated in class | transDMproB |
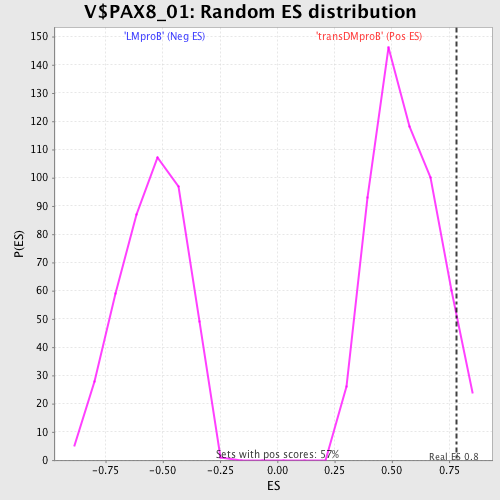
| GeneSet | V$PAX8_01 |
| Enrichment Score (ES) | 0.7844443 |
| Normalized Enrichment Score (NES) | 1.4089098 |
| Nominal p-value | 0.061728396 |
| FDR q-value | 0.60075355 |
| FWER p-Value | 1.0 |
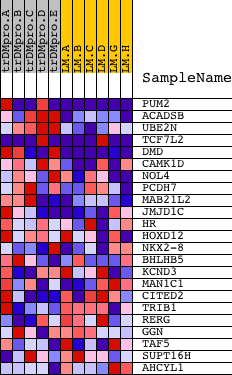
| PROBE | DESCRIPTION (from dataset) | GENE SYMBOL | GENE_TITLE | RANK IN GENE LIST | RANK METRIC SCORE | RUNNING ES | CORE ENRICHMENT | |
|---|---|---|---|---|---|---|---|---|
| 1 | PUM2 | 2071 8161 | 41 | 2.138 | 0.6189 | Yes | ||
| 2 | ACADSB | 7358 | 528 | 0.399 | 0.7087 | Yes | ||
| 3 | UBE2N | 8216 19898 | 1271 | 0.228 | 0.7351 | Yes | ||
| 4 | TCF7L2 | 10048 5646 | 1520 | 0.193 | 0.7777 | Yes | ||
| 5 | DMD | 24295 2647 | 2070 | 0.125 | 0.7844 | Yes | ||
| 6 | CAMK1D | 5977 2948 | 4430 | 0.021 | 0.6636 | No | ||
| 7 | NOL4 | 2028 11432 | 4532 | 0.020 | 0.6638 | No | ||
| 8 | PCDH7 | 7029 3460 | 4770 | 0.017 | 0.6560 | No | ||
| 9 | MAB21L2 | 15305 | 4809 | 0.017 | 0.6588 | No | ||
| 10 | JMJD1C | 11531 19996 | 5574 | 0.012 | 0.6211 | No | ||
| 11 | HR | 3622 9119 | 7022 | 0.006 | 0.5450 | No | ||
| 12 | HOXD12 | 9113 | 7363 | 0.005 | 0.5282 | No | ||
| 13 | NKX2-8 | 9465 | 7386 | 0.005 | 0.5285 | No | ||
| 14 | BHLHB5 | 15629 | 8041 | 0.003 | 0.4943 | No | ||
| 15 | KCND3 | 15464 | 10573 | -0.001 | 0.3586 | No | ||
| 16 | MAN1C1 | 10514 6064 15714 | 12478 | -0.006 | 0.2578 | No | ||
| 17 | CITED2 | 5118 14477 | 13352 | -0.008 | 0.2132 | No | ||
| 18 | TRIB1 | 22467 | 13372 | -0.008 | 0.2147 | No | ||
| 19 | RERG | 16949 | 13630 | -0.009 | 0.2036 | No | ||
| 20 | GGN | 2472 1171 18312 | 14042 | -0.011 | 0.1848 | No | ||
| 21 | TAF5 | 23833 5934 3759 | 15301 | -0.024 | 0.1242 | No | ||
| 22 | SUPT16H | 8541 | 16016 | -0.046 | 0.0993 | No | ||
| 23 | AHCYL1 | 6037 | 17099 | -0.139 | 0.0816 | No |